Bing Statistics 2026: The Numbers Behind Microsoft Ads Growth
Author: Jordan Blake
Short version for anyone who skims first. Microsoft pulled in $15.18 billion in search advertising revenue across its 2026 financial year, up from $13.88 billion a year earlier.
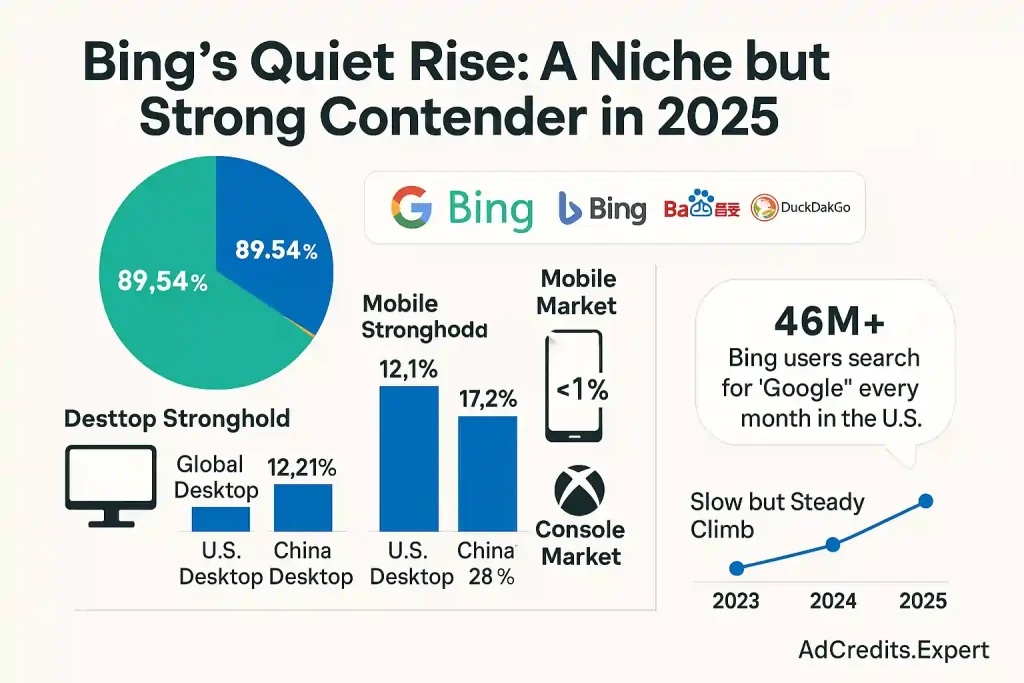
Bing holds roughly 4.7% of worldwide search, yet grabs close to 9% on desktop and about 8.7% in the United States.
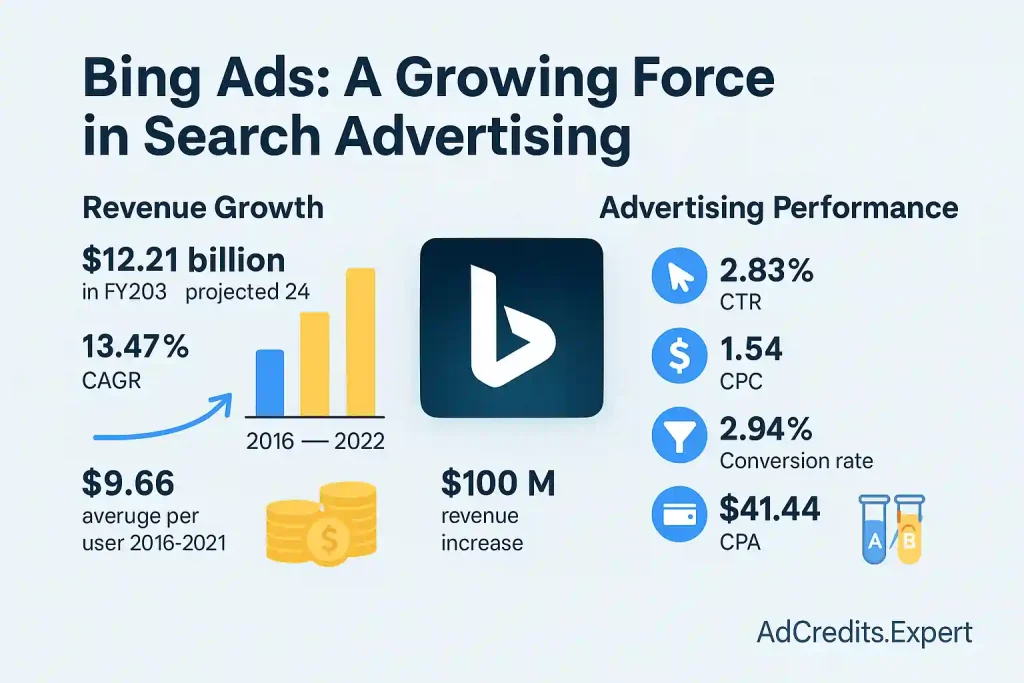
Clicks still cost around $1.54 on average, some 30% to 40% below Google. We buy media on Microsoft Advertising every week at AdCredits Expert.
So these Bing statistics for advertisers come from live accounts and verified filings, never recycled fluff.
Bing Market Share In 2026: The Number Everyone Quotes Wrong
Start with the headline figure, because most articles butcher it. Bing sits near 4.7% of worldwide search across every device, with Google holding roughly 91%.
That single number makes Bing look irrelevant. Media buyers who stop reading there leave cheap conversions on the table every single month.
The all-device figure gets dragged down by mobile, where Bing barely registers at 0.65%. Almost nobody sets Bing as a default on a phone, and Microsoft has no handset business to fix that.
Change the lens to desktop and the picture flips hard. Bing takes between 9% and 10.4% of desktop search worldwide, depending on which month you pull the reading.
In the United States, Bing holds about 8.7% across all devices. Desktop-only US share runs closer to 14%, and rises again once Yahoo and AOL partner traffic joins the count.
Our media buyer read: Judge Bing by where your buyers actually sit. A B2B SaaS audience working on a Windows laptop looks nothing like a 4.7% global average.
Bing Search Share Across Every Device Type

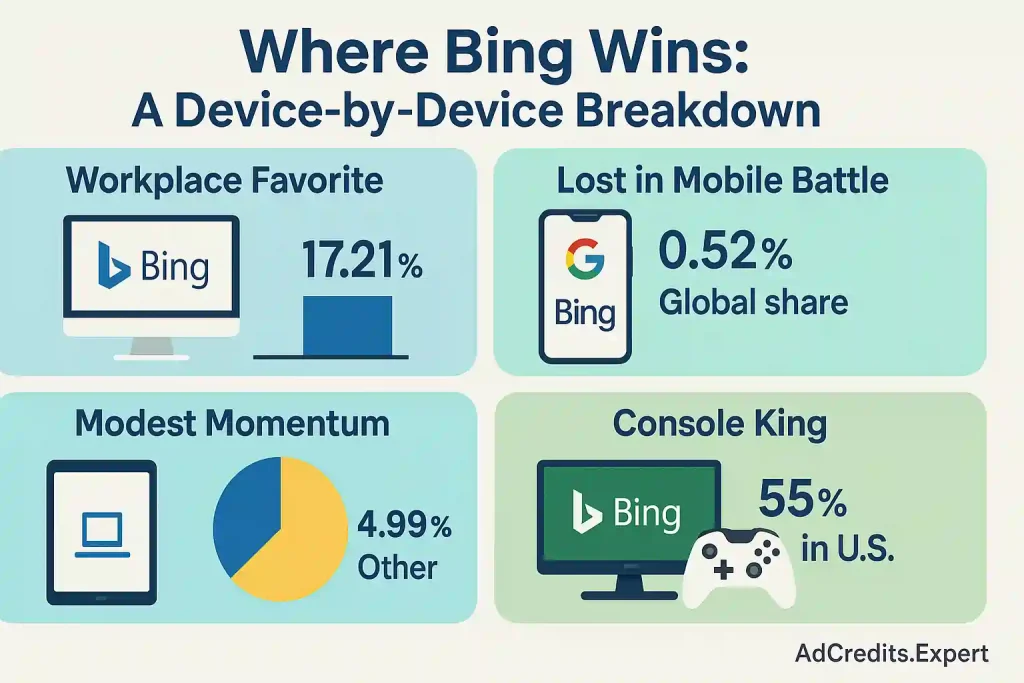
Device split is the single most useful cut of Bing data an advertiser can hold. We track these readings monthly across our own accounts and against public trackers.
Read those bars from the bottom up rather than the top down. Bing looks negligible on phones and genuinely competitive everywhere people sit down to work.
Console share surprises most buyers we speak to. Xbox and several other consoles route search through Bing by default, handing Microsoft a category win nobody talks about.
Gaming, esports and hardware advertisers get an audience there with almost no auction pressure. We have run console-heavy campaigns at click prices that would look like typos on Google.
Country Level Bing Data That Changes Media Plans
Global averages hide the markets where Bing genuinely competes. Two countries in particular now make Microsoft Advertising a serious line item rather than a side test.
Japan turned into the standout story of 2026. Bing climbed past 36% of Japanese search after Copilot rolled deep into Windows and Edge there.
China gives Microsoft its second unusual win. Bing holds around 23% of Chinese search across devices and roughly 39% of desktop search, ahead of Baidu on computers.
| Market | Bing Share, All Devices (2026) | Leading Engine | Advertiser Read For Budget Planning |
|---|---|---|---|
| Japan | Around 36.4% | Google at 55.4% | Near parity, treat Microsoft as a primary channel |
| China | Around 23.2% | Baidu at 47.4% | Second engine nationally, first on desktop |
| United States | 8.63% to 8.73% | Google at 86.6% | Best mix of volume and low competition |
| Germany | Around 7.1% | Google above 88% | Strong for B2B and industrial verticals |
| United Kingdom | Around 6.2% | Google above 91% | Reliable finance and insurance volume |
| Worldwide average | 4.68% | Google at 91.3% | Useful for benchmarking, poor for planning |
Japanese share moved by nearly thirty points inside eighteen months. Very few channels shift that fast, and early advertisers there bought inventory at launch prices.
From our own accounts: We now build separate Microsoft budgets for Japan and Germany rather than folding them into a global line. Blended planning hides the best returns.
Microsoft Search Advertising Revenue Hit $15.18 Billion

Money tells you how healthy an auction really is. Microsoft reported $15.176 billion in search advertising revenue across its 2026 financial year, which closed at the midpoint of the calendar year.
Growth came in around 10% excluding traffic acquisition costs. Amy Hood pointed to higher revenue per search alongside rising volume across Edge and Bing.
Set against Microsoft’s $331.8 billion in total revenue, search looks tiny. Judged as a standalone advertising business, though, it outranks most publicly traded ad platforms on earth.
| Financial Year | Microsoft Search Advertising Revenue | Year On Year Change | What Drove Movement |
|---|---|---|---|
| 2022 | $11.59 billion | Up 25% | Post pandemic recovery in retail and travel bidding |
| 2023 | $12.21 billion | Up 5.3% | Soft advertising market, first Bing Chat rollout |
| 2024 | $12.31 billion | Up 0.8% | Flat year, third party partnerships still ramping |
| 2025 | $13.88 billion | Up 12.7% | Copilot volume plus stronger revenue per search |
| 2026 | $15.18 billion | Up 9.4% | Edge growth, AI surfaces, higher advertiser count |
| 2027 (our call) | Around $16.6 billion | Up 9.4% | Copilot ad inventory monetising at scale |
Our $16.6 billion figure for 2027 is an AdCredits Expert call, not a Microsoft guide. We built it off the reported 2026 base, held growth near current pace, then trimmed slightly for a maturing United States auction.
Notice the shape of that run. Revenue barely moved between 2023 and 2024, then reaccelerated sharply once AI surfaces started carrying ads.
What this means for your budget: A growing auction means rising prices ahead. Claiming Microsoft Advertising credit before costs climb further is simply cheaper money.
What A Bing Click Actually Costs Advertisers Now
Cost per click is where Microsoft earns its place in most media plans. The cross industry average on Microsoft Advertising sits near $1.54, against roughly $2.69 on Google search.
Some datasets put the gap wider still. Search network readings show Microsoft near $1.37 against Google at $2.06 for comparable keyword sets.
Take either measure and the direction holds. Clicks on Microsoft cost roughly 30% to 40% less than the same intent bought on Google.
Fewer bidders explain most of that discount. Microsoft also still serves some ad slots that Google retired years ago, letting lower bids find placement.
Bing Ads Cost Per Click By Industry Vertical

Averages flatten out enormous differences between verticals. Legal clicks cost many times what retail clicks cost on either platform.
| Industry | Microsoft Ads Average CPC | Google Ads Average CPC | Approximate Saving | Cost Tier |
|---|---|---|---|---|
| Arts & Entertainment | $0.94 | $1.60 | 41% | Low |
| Shopping & Retail | $1.24 | $1.90 | 35% | Low |
| Travel & Hospitality | $1.38 | $2.30 | 40% | Low |
| Real Estate | $1.72 | $2.55 | 33% | Mid |
| Automotive | $2.05 | $3.05 | 33% | Mid |
| Health & Fitness | $2.68 | $4.05 | 34% | Mid |
| Finance & Insurance | $3.45 | $5.20 | 34% | High |
| B2B Software & SaaS | $3.90 | $5.85 | 33% | High |
| Home Services | $4.20 | $6.55 | 36% | High |
| Legal Services | $4.65 | $8.58 | 46% | Premium |
Legal shows the widest gap in our data at roughly 46%. Personal injury and family law bidding on Google has become brutal, whilst Microsoft auctions stay comparatively calm.
Retail runs the narrowest spread of any vertical we track. Product bidding on Microsoft has tightened as more merchants feed catalogues into Performance Max campaigns.
Money check for buyers: Never judge a click on price alone. A $4.65 legal click stays cheap when one signed case pays five figures.
Click Through Rates On Microsoft Ads Beat Expectations
Cheaper clicks usually mean weaker engagement. Microsoft Advertising breaks that rule, and the gap has widened over the past two years.
Cross industry click through rate on Microsoft now sits around 3.1%, lifted from 2.83% in earlier benchmark sets. AI generated ad suggestions drove much of that jump.
Three structural reasons explain stronger engagement. Each one is worth understanding before you write a single ad.
Shopping formats perform better still against their Google equivalents. Microsoft Shopping ads report click through rates roughly 45% above Google Shopping for matching product categories.
Quality Score rewards that engagement directly. Higher click rates pull your cost per click down further, so the advantage compounds inside a well built account.
Conversion Rate And Cost Per Acquisition Benchmarks
Clicks flatter reports, conversions pay salaries. Average conversion rate on Microsoft Advertising sits near 2.94% across all verticals, edging past Google on like for like keyword sets.
Cost per conversion is where the platform really separates itself. Figures run from about $15 in hospitality up to $73 in legal services.
| Vertical | Microsoft Ads Click Through Rate | Conversion Rate | Cost Per Conversion | Saving Versus Google |
|---|---|---|---|---|
| Travel & Hospitality | 2.95% | 3.55% | $15 | Around 38% |
| Apparel & Accessories | 3.33% | 3.10% | $21 | Around 34% |
| Shopping & Retail | 3.06% | 2.80% | $26 | Around 29% |
| Automotive | 2.64% | 3.20% | $34 | Around 31% |
| Real Estate | 2.20% | 5.13% | $41 | Around 27% |
| Careers & Employment | 2.48% | 6.81% | $46 | Around 40% |
| Finance & Insurance | 3.51% | 5.57% | $58 | Around 33% |
| B2C Services | 2.12% | 2.90% | $62 | Around 25% |
| Legal Services | 2.35% | 3.05% | $73 | Around 46% |
| All industries | 3.10% | 2.94% | $39 | Around 31% |
Careers and employment posts the strongest conversion rate in our dataset at 6.81%. Job seekers on desktop convert quickly, and Microsoft owns a huge slice of workplace machines.
Buyer’s note on campaign imports: Import your Google campaigns to start, then rebuild bids from scratch. Copied bid strategies overspend badly in a thinner auction.
Who Actually Uses Bing? The Audience Advertisers Undervalue

Search share tells you how much volume sits available. Audience quality tells you margin, and Bing scores unusually well on the second measure.
Age skews older than most buyers expect. Average Bing user age sits near 45, against roughly 38 on Google.
Household income skews meaningfully higher as well. Around 41% of United States Bing users report household income above $100,000, and close to half fall inside the top income quartile.
| Audience Attribute | Bing Figure (2026) | Why Media Buyers Should Care |
|---|---|---|
| Average user age | Around 45 years | Older buyers hold more disposable income and settled credit |
| Top income quartile share | 41% to 48% in the United States | Higher average order values on retail and finance offers |
| Management level or above | Around 32% of users | Decision makers reachable without LinkedIn premiums |
| Gender split | Roughly 60% male, 40% female | Skews campaigns toward tech, finance, motoring, gaming |
| Product research usage | 54% to 55% start research on Bing | Commercial intent higher than raw share suggests |
| Desktop dominance | Over 70% of sessions on computers | Longer forms and higher value baskets convert better |
| Users under 45 | Around 73% | Audience is not only retirees, contrary to old myths |
That management figure deserves attention from B2B teams. Roughly 32% of Bing users hold a management role or higher against 24% on Google.
Microsoft layers LinkedIn profile targeting on top of search campaigns. Company, job function and industry targeting on a search auction exists nowhere else in paid media.
Straight talk from us: B2B advertisers ignoring Microsoft Advertising are paying LinkedIn prices for audiences they could reach at search costs.
Copilot Rewrote The Advertising Maths At Microsoft
No single product changed Bing economics more than Copilot. Microsoft reported around 420 million monthly active Copilot users during 2026, up roughly 82% year on year.
Roughly 160 million of those sit on enterprise licences. Every one of them represents a work session that never touches Google.
Query behaviour on AI surfaces differs sharply from classic search. Commercial intent appears in about 35% of Copilot sessions, against 22% on standard Bing queries.
Fewer touchpoints, higher intent per interaction. Microsoft made exactly that argument at its 2026 Activate event, and our own account data backs the claim.
Copilot Search Ads And Showroom Formats
Microsoft built genuinely new ad surfaces rather than pasting text ads into chat. Two formats matter most to advertisers right now.
Early reported click through rates on Copilot placements run between 1.2% and 1.8%. Product categories such as electronics and fashion push toward 2.3%.
Advertisers already running Performance Max on Microsoft picked up roughly 18% additional reach and 12% more impressions from Copilot inventory. Those gains landed without any rise in cost per click.
AdCredits Expert verdict: Copilot inventory is priced like a beta today. Buyers who build Performance Max campaigns now inherit that pricing before demand catches up.
AI Max, Automation And Bidding Adoption Rates

Automation reached Microsoft later than Google, and that lag now works in an advertiser’s favour. Automated bidding runs across about 74% of Microsoft accounts against 82% on Google.
Microsoft opened AI Max for Search to every account during 2026 rather than keeping it invitation only. Query matching, asset personalisation and smarter URL routing all sit inside that release.
Smart Shopping campaigns are being retired and folded into Performance Max. Retail advertisers who delay that migration risk losing catalogue coverage across Copilot surfaces.
Bidding algorithms behave differently on thinner data. Microsoft automated strategies reportedly perform around 14% better than Google equivalents at lower conversion volumes.
Reach You Simply Cannot Buy Through Google
Incremental reach is the most underrated argument for Microsoft Advertising. Partner inventory extends well past bing.com itself.
The Microsoft Search Network reaches over 900 million unique searchers worldwide. Yahoo, AOL, DuckDuckGo and Ecosia all pull results through Microsoft technology.
Roughly 63 million United States searchers on that network never appear in Google Ads at all. Around 44 million United States desktop searchers there report household income above $100,000.
Microsoft Advertising now operates across 187 markets, some five and a half times more than it covered in 2022. International expansion made the platform viable for brands that once dismissed it as United States only.
Our honest call: Treat Microsoft spend as incremental reach, never as cannibalised Google spend. Overlap between the two audiences is far smaller than most attribution models assume.
The Advertiser Gap That Keeps Bing Cheap

Cheap clicks exist for one simple reason. Not enough advertisers bother showing up to the auction.
Only about 36% of United States advertisers actively run Microsoft Ads. Google Ads sits near 80% adoption among the same group.
That gap is the entire arbitrage. Every advertiser who skips Microsoft leaves the auction thinner for everyone who stays.
Typical budget allocation reflects the same neglect. Most accounts running both platforms send only 10% to 15% of search budget toward Microsoft.
We think that split is wrong for most accounts. Verticals with heavy desktop research behaviour justify 20% to 25% of the search budget on Microsoft.
From our own spend: Moving a finance client from 10% to 22% Microsoft allocation cut blended cost per lead noticeably. Same creative, same offer, thinner auction.
Bing Traffic Volume And Search Query Behaviour
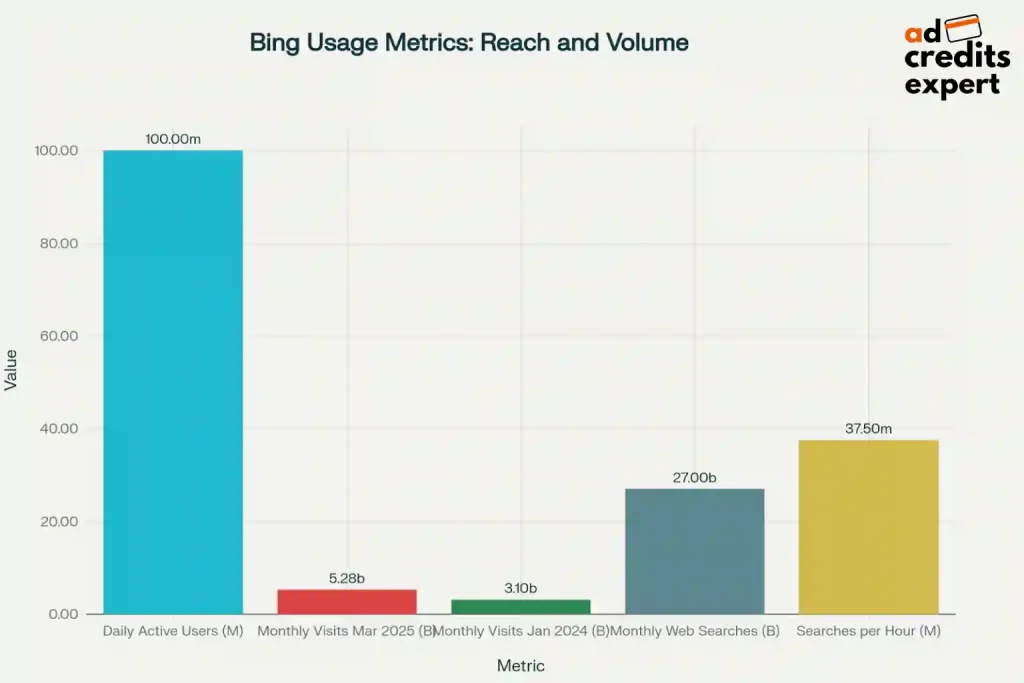
Raw traffic numbers vary wildly between trackers, so treat any single figure with caution. Bing serves roughly 450 million daily searches by most reasonable counts.
Site visit measurements run between 2.1 billion and 3.5 billion monthly depending on methodology. Microsoft itself has claimed around one billion daily active users across Bing surfaces.
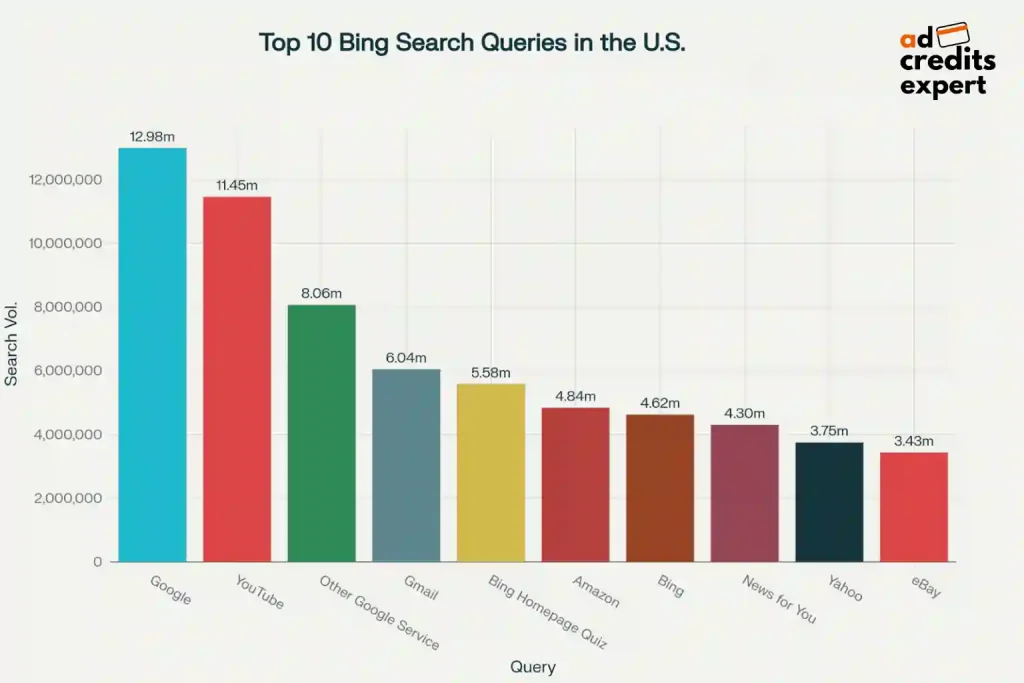
Query mix matters more than volume for advertisers. Bing carries a heavier share of branded and navigational searches than Google does.
Plenty of people reach Bing without knowing it. Windows taskbar searches, Edge address bar queries and console searches all route through Microsoft by default.
Microsoft Ads Versus Google Ads: The Side By Side
Buyers ask us for one clean comparison table constantly. Below is the honest version, including where Microsoft loses.
| Metric | Microsoft Advertising | Google Ads | Which Platform Wins |
|---|---|---|---|
| Average cost per click | $1.54 | $2.69 | Microsoft by roughly 43% |
| Cross industry click through rate | 3.10% | 3.52% | Google on raw average |
| Shopping ad click through rate | Around 45% higher | Baseline | Microsoft clearly |
| Cost per conversion | $15 to $73 by vertical | Around 31% higher | Microsoft across most verticals |
| Available search volume | Around 4.7% worldwide | Around 91% worldwide | Google by a huge margin |
| Mobile reach | 0.65% share | Above 95% share | Google outright |
| Desktop reach | 9% to 10.4% worldwide | 83.5% to 86% | Google, though gap narrows |
| Professional audience targeting | LinkedIn profile targeting built in | Not available | Microsoft uniquely |
| Automated bidding adoption | 74% of accounts | 82% of accounts | Google on maturity, Microsoft on low volume |
| Starter credit availability | Widely available to new accounts | Widely available to new accounts | Even, both worth claiming |
Read that table properly and the strategy writes itself. Google supplies volume, Microsoft supplies efficiency, and serious accounts run both.
Microsoft Audience Network Reach Past The Results Page

Paid search on Microsoft does not stop at the results page. The Microsoft Audience Network places native ads across MSN, Outlook, Edge and thousands of partner properties.
Placement quality separates that network from most display inventory. Ads sit inside Outlook inboxes and MSN feeds rather than scattered across low quality arbitrage sites.
Targeting there runs on Microsoft first party intent data. In market audience segments report roughly 18% higher conversion rates than broad reach settings on the same budget.
Click prices on the Audience Network run far below search, often under $0.60. Treat that inventory as a demand building layer feeding your search campaigns, never as last click sales.
Testing tip from our team: Split Audience Network reporting away from search before judging results. Blended reporting makes cheap native clicks look like broken search performance.
Retail Feeds, Merchant Data And Agentic Shopping
Retail advertisers face the sharpest changes on Microsoft right now. Performance Max campaigns require a Merchant Center catalogue and clean conversion tracking to function properly.
Microsoft pushed its Universal Commerce Protocol during 2026 to feed structured product data into AI shopping experiences. Copilot Checkout sits alongside that release, shortening the path between an answer and a purchase.
Product feed quality now decides visibility on AI surfaces. Thin titles, missing attributes and stale pricing keep products out of Copilot recommendations entirely.
Shopping economics still favour Microsoft on most catalogues. Cheaper clicks combined with a 45% click through advantage over Google Shopping produces a meaningful gap in cost per sale.
Retail read from us: Fix your feed before raising bids. Attribute completeness moves Microsoft Shopping performance faster than any bid adjustment we have tested.
Organic Bing Visibility Still Feeds Paid Performance
Paid teams often ignore organic Bing entirely, which quietly costs them money. Microsoft grounding now supplies current information to several leading AI assistants beyond Copilot itself.
Pages indexed well on Bing therefore surface across a wider set of AI answers than most marketers realise. Brand visibility inside those answers lifts branded search volume, which lowers your blended acquisition cost.
Indexing on Bing runs faster than many teams expect thanks to IndexNow support. Publishers pinging updates directly see new pages appear within hours rather than days.
Branded queries carry unusual weight on Bing compared with Google. A heavier navigational query mix means brand terms convert at very low cost when you bid on them defensively.
Where Microsoft Advertising Genuinely Underperforms

We publish honest numbers, including the unflattering ones. Microsoft Advertising fails outright in several scenarios, and pretending otherwise wastes your money.
Mobile first brands should look elsewhere. A 0.65% mobile share cannot support an app install campaign or a Gen Z retail launch.
Volume ceilings arrive quickly in narrow niches. Long tail keyword sets that deliver hundreds of Google clicks weekly may return a handful on Microsoft.
Retail bidding on Microsoft has tightened noticeably over the past year. In some product categories Microsoft click prices now match or exceed Google, so test your own keyword list before assuming a discount.
Where we push back: Anyone promising Microsoft Advertising as a Google replacement is selling something. Position paid search on Microsoft as an efficiency layer, never a volume engine.
The Search Ad Market Shift Behind These Bing Statistics
Bing gains look small until you place them against a wider market move. Google will take about 48.5% of United States search advertising spend during 2026.
Falling below half marks a first in more than two decades. Amazon claimed the largest piece of that ceded share, though Microsoft picked up meaningful ground too.
Global advertising spend passed one trillion dollars during 2025. Search remains the largest single slice of that pot, so even small share shifts move billions.
Bing and Edge have gained share for five consecutive years by Microsoft’s own account. Slow, compounding gains beat dramatic spikes when you are buying media against them.
What we do with this: We plan against a search market with three real bidders now, not one. Budget that assumed a Google monopoly is budget priced badly.
Our 2027 Forecast For Bing And Microsoft Advertising

Time for our own numbers rather than someone else’s. These calls come from the accounts we run and the reported figures above.
That final point carries the real warning. Cheap Microsoft clicks exist because attention has not arrived yet.
Once adoption crosses roughly 45%, auction density rises and the discount narrows. Buyers who build accounts, gather conversion data and claim starter credit now will hold the cost advantage when that happens.
Practical next step: Load a Microsoft account with starter credit before you scale spend. Testing a new channel on platform money rather than yours changes the risk maths entirely.
How We Built These Bing Statistics
Every figure above went through the same checks we apply to our own campaign reporting. Vendor filings came first, third party trackers second, benchmark studies third.
Revenue numbers came straight from Microsoft’s annual filings rather than summaries of summaries. Market share readings were pulled from live tracker data instead of screenshots recycled across blogs.
Where sources disagreed, we published the range rather than picking a flattering midpoint. Bing share readings genuinely differ by a full percentage point between trackers, and pretending otherwise would mislead you.
Cost benchmarks were sense checked against accounts we buy media in. Any figure that contradicted live auction behaviour got flagged, rechecked or dropped.
Bing Statistics 2026: Questions Advertisers Ask Us Most
What Is Bing Market Share In 2026?
Bing holds roughly 4.7% of worldwide search across every device. Desktop share runs between 9% and 10.4%, whilst United States share sits near 8.7%.
How Much Does Microsoft Advertising Cost Per Click?
Average cost per click sits near $1.54 across all industries. Legal clicks reach about $4.65, and arts or entertainment clicks fall below $1.
Is Bing Cheaper Than Google Ads?
Yes, cheaper by roughly 30% to 40% on average. Cost per conversion runs about 31% lower across matching verticals, with legal showing the widest gap near 46%.
How Much Revenue Does Bing Generate For Microsoft?
Microsoft reported $15.18 billion in search advertising revenue across its 2026 financial year. That figure rose from $13.88 billion the year before.
Do Ads Appear Inside Microsoft Copilot?
They certainly do. Performance Max campaigns already serve into Copilot search, alongside Showroom ads that open an interactive brand experience beside the chat window.
What Share Of Search Budget Should Go To Microsoft?
Most accounts allocate 10% to 15% today. Our call is that desktop heavy verticals such as B2B software, finance and legal justify 20% to 25%.
Can New Advertisers Still Claim Microsoft Ads Credit?
New accounts still qualify for starter credit, and cashback through partners sits on top. We keep verified deals live on our deals page with no signup wall.

Sources And Further Reading
- Microsoft Investor Relations, Full Year 2026 Results
- Statista, Microsoft Search And News Advertising Revenue
- StatCounter Global Stats, Search Engine Market Share
- Statista, Worldwide Search Engine Referral Share
- eMarketer, US Search Advertising Forecast 2026
- Backlinko, Microsoft Bing Usage And Revenue Data
- Microsoft Advertising, Activate 2026 Product Announcements
- WordStream by LocaliQ, Search Advertising Benchmarks
- eMarketer, Microsoft Copilot AI Ad Formats
- SEC EDGAR, Microsoft Corporation Annual Filings
About the author

Jordan Blake
A digital advertising specialist with years of experience in optimizing ad spend and leveraging promotional credits across platforms like Google Ads, Meta Ads, and more.

Leave a Reply