AI Advertising Statistics 2026: Market Size and Ad Spend
Author: Jordan Blake
AI advertising statistics 2026 tell a story most media buyers already feel in their CPMs: the auction is no longer human.
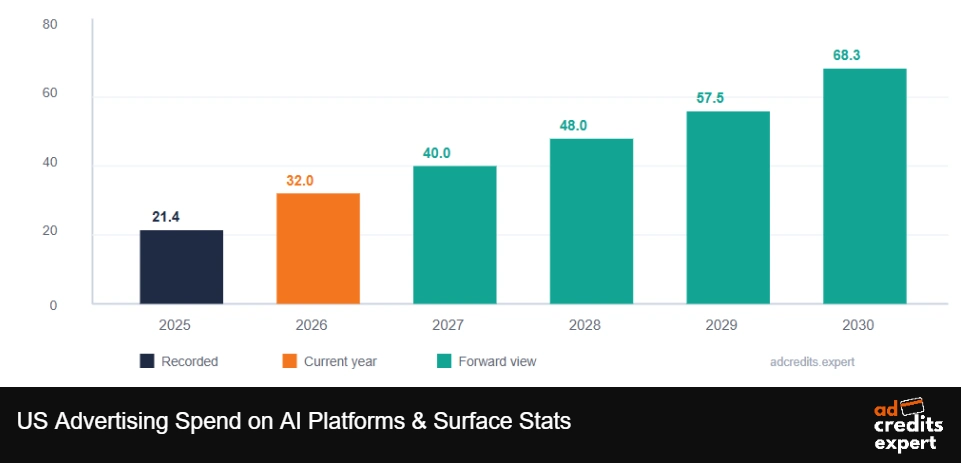
Global ad spend crossed $1 trillion this year. US advertisers will pour $32.03 billion into AI ad surfaces alone. Meta’s automated ad engine now runs at a $60 billion annual clip.
Google stops asking permission and force-upgrades search campaigns to AI Max. ChatGPT went from zero ad revenue to $100 million annualised in six weeks flat.
Generative AI creative, machine learning bid strategies, agentic buying and ads inside AI answers all landed inside the same twelve months. Most roundups on AI ad spend recycle vendor press releases. This one doesn’t.
We buy media daily across 25+ platforms and track every ad credit, cashback rate and CPC shift as it happens. What follows is verified 2026 data on AI-powered advertising, paired with numbers pulled straight off our own desk.
Every outside figure is fact checked. Every call we make is ours to defend.
What We Do And Why These Numbers Come From Us
We run AdCredits Expert. Our job is simple. We hunt down verified ad credits and cashback across 25 plus platforms, then we tell media buyers how to spend them without lighting money on fire.
That means we watch spend behaviour across TikTok, Meta, Google, Reddit, Snapchat, Amazon and LinkedIn every single week. More than 50,000 buyers use our deal sheet. Roughly 127 live offers move through our system at any moment.
So when we talk about AI-powered ad platforms, we are not theorising. We see what happens when a founder drops $500 of Reddit credit into an automated campaign. We also see what happens when an agency scales that same play across 18 accounts.
This piece pulls together public 2026 data plus our own reads. Every outside figure is fact checked. Every call we make is labelled as ours.
AI Advertising In 2026: The Headline Figures
Most AI advertising statistics open with market size, so ours will too. AI in advertising is a real category now, with real revenue attached to it.
Notice something. Those are two different things. One measures AI tooling sold to advertisers. Another measures ad dollars placed inside AI products. Buyers confuse them constantly.
Market Size Table: AI Advertising And Adjacent Categories
| Category | 2024 Value | 2025 Value | 2026 Value | 2030 Outlook | Annual Growth |
|---|---|---|---|---|---|
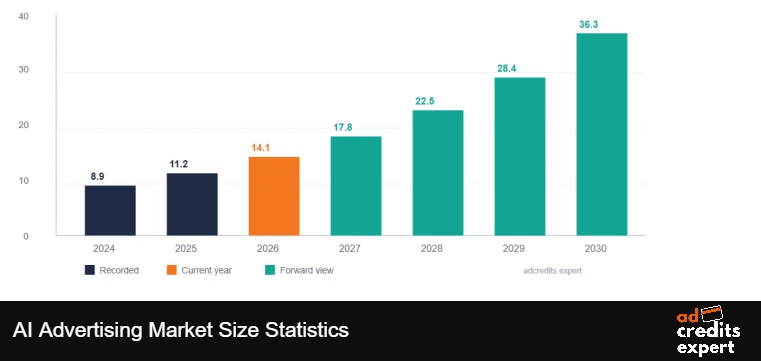
| AI in advertising (tools and platforms) | $8.9 billion | $11.17 billion | $14.12 billion | $36.34 billion | 26.4% |
| AI in marketing (wider stack) | $20.4 billion | $27.6 billion | $35.0 billion | $82.2 billion | 25.0% |
| Generative AI in advertising | $2.7 billion | $3.37 billion | $4.18 billion | $9.81 billion | 23.8% |
| US ad spend on AI surfaces | Not tracked | $21.4 billion | $32.03 billion | $68.25 billion | 20.8% |
| Global ad spend (all media) | $1.03 trillion | $1.11 trillion | $1.17 trillion | $1.42 trillion | 5.1% |
| Global digital ad spend | $700 billion | $766 billion | $835.8 billion | $1.05 trillion | 8.9% |
Read across a single row and growth looks tidy. Read down a column and something else shows up. AI tooling grows five times faster than total ad spend.
Straight from our desk: we expect AI ad tooling to clear $18 billion in 2027 and $23 billion in 2028. Our reasoning is dull but reliable. Platform-native tools are bundled free, so paid tooling growth comes from the middle layer of creative and measurement vendors.
Meta Built A $60 Billion AI Ad Machine
Meta is the clearest proof that automation sells. Its end to end AI ad suite, Advantage+ included, passed a $60 billion annual run rate.
Ad revenue tells a similar story. Meta grew ads 22% to $196 billion in 2025 and heads towards roughly $240 billion in 2026. That puts Meta ahead of Google in global net ad revenue for the first time.
Key 2026 figures worth pinning to your wall:
Here is what we see on our side. Advantage+ rewards accounts with clean conversion signal and punishes accounts without it. Credit-funded test budgets work brilliantly here because you can feed the algorithm without risking core spend.
Meta AI Ad Products And What They Actually Change
| Product | What It Automates | Reported Performance Effect | Who Gains Most | Main Risk |
|---|---|---|---|---|
| Advantage+ Sales | Audience selection, placement, budget split | About 22% higher ROAS | Ecommerce and DTC brands | Loss of audience visibility |
| Advantage+ consolidation | Campaign structure and learning phase | Up to 32% lower CPA | Accounts with many small campaigns | Short term volatility after merge |
| AI video generation suite | Video assets from static product images | $10 billion combined run rate | Small teams without video crews | Generic output at scale |
| Background and text variants | Creative permutations per audience | Creative cost down to roughly 10% of manual | Catalogue-heavy retailers | Brand consistency drift |
| Meta AI business assistant | Account diagnostics and recommendations | Faster issue spotting, no public lift figure | Founders running solo | Over trusting generic advice |
| Ads AI connectors | Direct agent access to campaign data | Removes API and developer overhead | Agencies with 5 plus accounts | Governance and access control |
Our read on this: we expect Meta AI ad infrastructure to clear an $85 billion run rate before the end of 2027. Adoption is no longer the growth driver. Price per outcome is.
Google Is Not Asking Any More, It Is Upgrading You
Google took a different route. Rather than sell AI as an add on, Google is folding it into existing campaign types.
From September 2026, campaigns running DSA, automatically created assets or campaign level broad match get moved to AI Max automatically. No opt in required.
Adoption numbers as of 2026:
Performance claims need care. Google reports 7% more conversions at similar CPA when the full AI Max suite runs. Campaigns moving off heavy exact and phrase match saw up to 27% conversion lift.
Independent retail analysis is less flattering. Across 250 plus retail campaigns, median revenue rose 13% while median CPA rose 16%. ROAS outcomes ranged from plus 42% to minus 35%.
Both things are true. AI Max grows volume. Efficiency does not automatically follow.
Ads Are Now Living Inside AI Answers
Search results changed shape, and ad inventory followed. Ads now appear at the bottom of roughly 25.5% of AI Overview results, a 394% year on year jump.
Google AI Mode reached 75 million daily active users and over 100 million monthly actives. AI Overviews appear on about 48% of all queries.
Commercial query data is sharper still:
Organic click behaviour shifted too. On informational queries, click through rates fell from 1.76% to 0.61% when AI features appear.
That gap is exactly why paid buying got busier this year. Free clicks got scarcer, so buyers moved budget.
AdCredits Expert call: we put AI search ad placements at 40% of commercial queries by mid 2027. Category spread stays wide. Pets, home services and consumer finance move first, regulated health moves last.
ChatGPT Ads: A Brand New Auction Landed Mid Year
OpenAI switched on advertising inside ChatGPT on 9 February 2026. Six weeks later, that pilot crossed $100 million in annualised revenue with 600 plus advertisers.
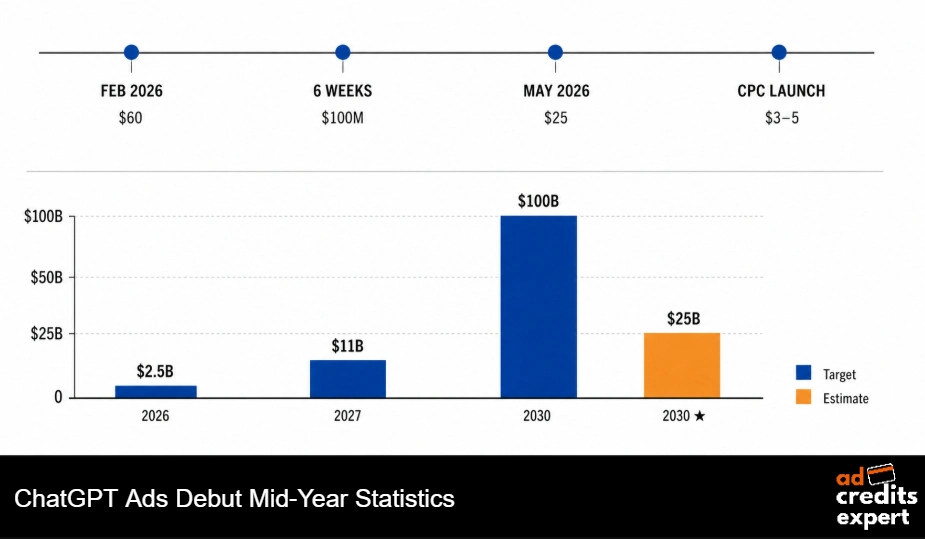
Pricing moved fast. Launch CPMs sat near $60 with a $200,000 minimum, managed through agency partners only. By early May, minimums were gone and CPMs sat near $25, with CPC bidding and floors of $3 to $5 by category.
Some context matters here. Early click through rates landed near 0.91%, roughly seven times below Google search baseline.
ChatGPT Advertising Milestones And Money
Timeline matters here, because pricing moved almost monthly:
Advertiser mix already spans retail, travel, telecoms and B2B software. That breadth tells you inventory is being sold on reach as much as intent.
Independent forecasts sit well under those internal targets. One widely quoted analyst view pegs ChatGPT advertising nearer $25 billion by 2030.
Our position is unglamorous. Treat conversational inventory as a learning line item until CPC data stabilises across at least two full quarters of your own spend.
Who Is Actually Using AI, And For What
Adoption stopped being the interesting question in 2026. Depth of use replaced it.
Then comes the reality check. Fewer than a third of marketers use AI for higher value work like governance, prediction or personalisation. Around two thirds of organisations remain stuck in pilot mode.
Marketer AI Adoption, Use Cases And Time Saved
| Measure | 2024 | 2025 | 2026 | Notes For Buyers |
|---|---|---|---|---|
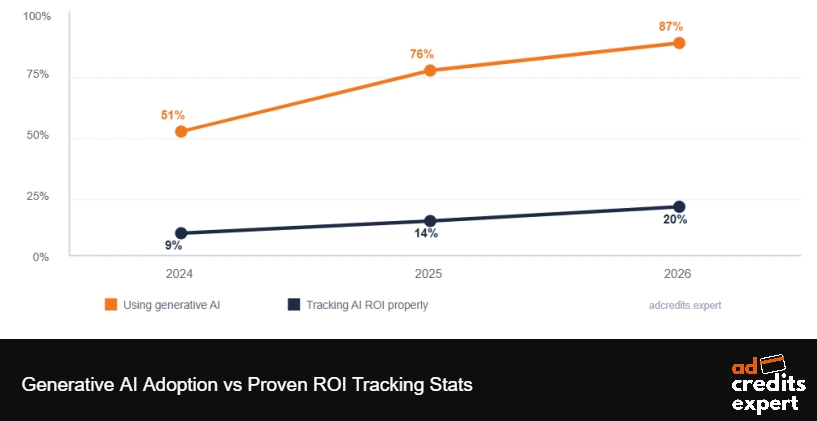
| Marketers using generative AI in a recurring workflow | 51% | 76% | 87% | Fastest adoption curve marketing has recorded |
| Enterprise team adoption | 62% | 81% | 94% | Laggard segment has nearly vanished |
| Micro teams under ten people | 34% | 57% | 73% | Free platform tools drove most of gain |
| Using AI for creative development | 68% | 74% | 77% | Still single biggest use case by volume |
| Using AI for bid and creative testing | 31% | 39% | 47% | Where measurable ad gains concentrate |
| Weekly hours saved per marketer | 2.6 | 4.4 | 6.1 | Senior staff save 8 to 10 hours |
| Organisations tracking AI ROI properly | 9% | 14% | 20% | Biggest gap in whole dataset |
That last row is the one we care about. Four out of five teams cannot prove what AI earned them.
What AI Actually Does To Campaign Performance
Strip away the marketing and a pattern shows up across platforms. AI reliably lifts volume. Efficiency depends on your data quality.
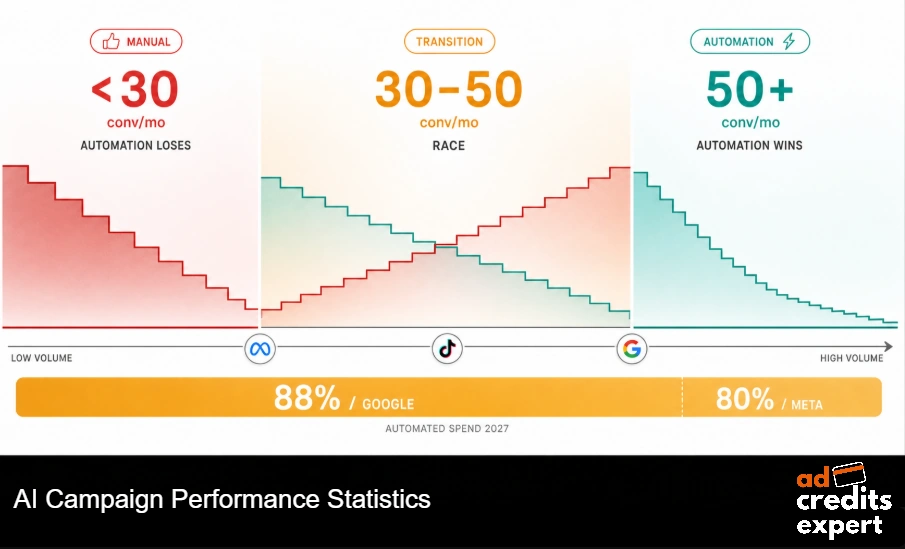
Published performance figures for 2026 cluster like this:
That final point costs small advertisers more money than anything else on this page. Automation without volume is guesswork with extra steps.
AI Campaign Performance Benchmarks By Automation Type
| Automation Type | Typical Volume Change | Typical Cost Change | Data Needed To Work | Best Fit | Our Confidence |
|---|---|---|---|---|---|
| Meta Advantage+ Sales | Up 20% to 35% conversions | CPA down up to 32% | Clean pixel plus catalogue feed | Ecommerce, DTC, subscription | High |
| Google Performance Max | Up around 13% conversions | CPA about 8% lower | Strong asset groups and feeds | Retail and multi channel brands | High |
| Google AI Max for Search | Up 7% to 27% conversions | CPA up around 16% in retail | Tight negatives and tracking | Lead generation before retail | Medium |
| Target CPA smart bidding | Up 25% to 55% volume | CPA down 18% to 38% | 30 plus conversions monthly | B2B and SaaS search | High |
| TikTok Smart+ automation | Volume gain varies by vertical | Creative cost falls sharply | High creative refresh rate | Short form video sellers | Medium |
| Conversational AI ad placements | Low click volume so far | CPC floors $3 to $5 | Strong landing page relevance | High consideration categories | Low, early days |
Buyer note from our team: we forecast automated campaign types reaching 88% of Google Ads spend and 80% of Meta spend during 2027. Manual buying survives in compliance-heavy verticals only.
Creative Volume Stopped Being The Bottleneck
For twenty years, output limited scale. You tested what you could afford to produce. Now that constraint has moved.
TikTok made the shift obvious. Symphony Creative Studio generates scripts, avatars and full videos inside Ads Manager, free to any advertiser account.
Numbers that explain why it matters:
So the bottleneck is no longer production. It is knowing which angle to test next, and reading results fast enough to matter.
We see this constantly with credit-funded accounts. Buyers generate 60 variants, run them all, then cannot explain why three won. Creative volume without creative testing discipline just burns budget faster.
Video Is Where AI Ad Budgets Are Heading Next
Video used to be the expensive format. AI removed most of that cost floor during 2026.
Meta creative tooling dropped production cost to roughly 10% of manual methods. TikTok pushed full video generation into every advertiser account at no extra charge.
Some numbers that frame the shift:
That last figure surprised us. Generated creative is more predictable than handmade creative, mostly because output variance is narrower.
Predictable is not the same as memorable. Brands still win on angle and casting, not render quality.
Amazon And Retail Media: The Quiet AI Winner
Search and social soak up attention. Retail media grew faster than both.
Retail media reached around $62 billion globally in 2026, growing 14.1% and outpacing every other digital channel. Amazon alone books $65 billion to $70.8 billion in ad revenue.
More telling, Google search share fell below half of all search ad spending for the first time in over twenty years. Amazon absorbed the largest share of what moved.
Why does that matter for AI buyers? Because retail media auctions run on purchase data rather than inferred intent. Automated bidding trains faster when the signal is a completed order.
We see this in cashback behaviour too. Amazon credits get consumed roughly twice as fast as display credits across our member base, because payback windows are shorter.
Our position on retail media ad networks is simple. If you sell physical product and you are not testing here, automation elsewhere will struggle to beat it on measured return.
Auction Prices: What Automation Did To CPMs And CPCs
Cheaper creative does not mean cheaper media. Often the opposite.
Cost signals across 2026 read like this:
Read those together and a pattern appears. Automation is very good at buying clicks. Buying customers is a harder problem, and auction pricing has caught up.
That gap is exactly why credits and cashback matter more in 2026 than in 2022. When media costs climb 13% and returns slip 10%, recovered spend becomes the margin.
Our number here: we expect blended CPCs to rise another 8% to 12% during 2027 across Google and Meta. Cheap inventory moves to newer surfaces, then prices in within about three quarters.
Agentic Ad Buying Moved From Slides To Shipping
2026 was the year agents started touching real money. Not fully, and not everywhere, but genuinely.
What shipped this year:
Buyer sentiment lags the tooling. 66% of agencies plan to adopt agentic AI ad buying, yet only 17% of organisations have deployed agents in production.
Meanwhile 40% of US ad buyers named agentic buying a top concern for 2026. Around 60% plan to raise AI media spending across the second half of this year.
What we are seeing: our number for 2027 is 30% of agency accounts running at least one supervised buying agent. Full autonomy stays rare because nobody wants an agent explaining a budget overrun to a client.
The Ugly Side: AI Made Ad Fraud Harder To Catch
Automation cuts both ways. Fraud got smarter at exactly the moment buying got more opaque.
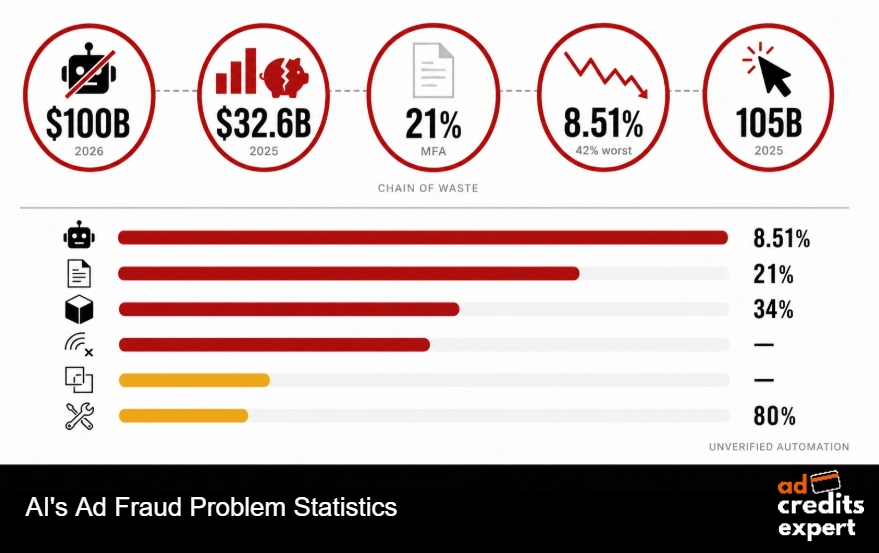
Fraud figures for the current cycle:
The mechanism changed too. Fraud now mimics scrolling, reading time and hesitation well enough to pass basic filters.
Worse, fraudulent conversions poison your training data. Bad signal teaches automated bidding algorithms to chase worthless inventory faster.
Where AI Era Ad Waste Actually Comes From
| Waste Source | Scale In 2026 | Why AI Makes It Worse | Detection Difficulty | Practical Counter Move |
|---|---|---|---|---|
| Sophisticated invalid traffic | 8.51% average, 42% worst case | Human mimicry defeats simple filters | Very high | Third party verification on all display |
| Made for advertising sites | About 21% of programmatic impressions | Generated content scales page supply | Medium | Exclusion lists plus placement reports |
| Black box campaign types | 34% of Google budgets in Performance Max | Placement visibility is limited | High | Channel reporting and search partner audits |
| Corrupted conversion signal | Affects most automated accounts | Fake events retrain bidding models | High | Server side tracking and value rules |
| Creative sameness at volume | Rising with generated assets | Similar prompts produce similar output | Low but ignored | Angle briefs before generation |
| Untracked AI spend | 80% of teams cannot prove ROI | Tool sprawl outpaces measurement | Medium | Single spend register per quarter |
Advertisers using platform AI properly are 27% more likely to keep waste under 10%. Automation is not the enemy. Unverified automation is.
Consumers Are Not Sold On AI Ads Yet
Performance data looks great. Audience sentiment looks messier.
- Seven in ten consumers say AI generated ads feel like something is missing.
- 72% believe AI makes authentic content harder to identify.
- 50% of US consumers would rather buy from brands avoiding generative AI in customer facing messages.
- Gen Z are nearly twice as likely as Millennials to feel negative about AI ads, at 39% versus 20%.
- 93% want to know how digital content was created or edited.
Disclosure is where things get interesting. 89% of advertisers using generative AI disclose at least sometimes, but fewer than half always do.
Among younger buyers, 73% said knowing an ad used AI would either raise or not change purchase likelihood. Disclosed AI creative has shown meaningful lifts in ad trustworthiness during controlled tests.
So the trust penalty is smaller than most brands fear. Hiding it is what actually costs you.
Platform Money Map: Where AI Ad Dollars Land
Budget concentration deserves a table of its own, because it shapes what credits are worth chasing.
| Platform | 2026 Ad Revenue | Growth Rate | Flagship AI Product | Credit Or Cashback Opportunity |
|---|---|---|---|---|
| Meta | About $243.5 billion | 24.1% | Advantage+ suite | Starter credit plus cashback on first spend |
| Google and YouTube | About $239.5 billion | 11.9% | AI Max and Performance Max | Starter credit with percentage cashback |
| Amazon Ads | $65 billion to $70.8 billion | Fastest among majors | Automated creative and sponsored placements | Credit plus high cashback for sellers |
| TikTok | Share still climbing | Double digit | Symphony and Smart+ | Largest cashback percentages we track |
| OpenAI | $2.5 billion targeted | New category | Conversational ad placements | No credit programme yet |
| Retail media networks | Around $62 billion | 14.1% | Automated bidding and audiences | Varies by retailer, rarely public |
Two platforms hold over half of global digital ad spend. Meta sits near 26.8% share, Google near 26.4%.
Google search share dipped below half of all search ad spending for the first time in two decades, landing at 48.5%. Amazon took the biggest slice of that ground.
Small Advertisers Versus Enterprise: The Results Gap
Adoption levelled out across company sizes. Outcomes did not.
Organisations running AI across more than 60% of paid campaigns report ROI lifts averaging 31.4%. Early stage adopters average 22.8%. Nine points separates them, and most of that gap comes down to data hygiene.
What large accounts have that small ones usually lack:
None of those need enterprise money. Three of them need discipline only.
Our honest view after watching thousands of credit-funded launches is this. Small advertisers lose to automation less often through budget and more often through impatience. Accounts get restructured every fortnight, so no model ever finishes learning.
Set a change window. Fourteen days minimum. Then judge the data instead of the dashboard mood.
Our Own Forward Calls For 2027 And 2028
Nobody pays us to publish forecasts, so we can be blunt about them. These are our reads, built from spend patterns we watch weekly.
We will get some of these wrong. Publishing them anyway keeps us honest, and lets you argue with the reasoning rather than the vibes.
How Media Buyers Should Actually Play This
Enough numbers. Here is what we tell buyers who ask us what to do on Monday morning.
One more thing. Cashback and starter credits move real margin for agencies. Recovering 20% to 50% of test spend changes what you can afford to learn.
These AI advertising statistics only pay off if they change a budget line. Numbers without a decision attached are trivia.
Frequently Asked Questions About AI Advertising In 2026
How Big Is AI Advertising In 2026?
AI in advertising reached $14.12 billion in 2026, up from $11.17 billion in 2025. Wider AI marketing tooling sits near $35 billion. Separately, US advertisers place $32.03 billion into AI platforms and surfaces this year.
What Share Of Marketers Use AI For Advertising?
87% of marketers use generative AI in at least one recurring workflow during 2026. Enterprise teams reach 94%. Around 47% apply AI specifically to bid optimisation and creative testing.
Does AI Actually Improve Ad Performance?
Usually yes, with conditions. Autonomous campaigns lift ROAS by 18% to 32% when conversion data is clean. Below 30 conversions per month, manual bidding often performs better because the model lacks signal.
Are Ads Showing Inside AI Search Results?
Yes. Ads appear at the bottom of about 25.5% of AI Overview results. Text ads showed on 29.45% of commercial AI Mode keywords, rising to 53.56% for keywords with CPCs above $10.
How Much Does ChatGPT Advertising Cost?
Launch pricing sat near $60 CPM with a $200,000 minimum. By May 2026, minimums were removed and CPMs sat near $25, with CPC bid floors of $3 to $5 depending on category.
Is AI Increasing Ad Fraud?
Fraud is growing alongside automation. Losses head towards roughly $100 billion in 2026. Made for advertising sites take about 21% of programmatic impressions, and invalid traffic averages 8.51% globally.
Should Brands Disclose AI Generated Ads?
Our answer is yes. 93% of consumers want to know how content was created. Among Gen Z and Millennial buyers, 73% said AI disclosure would either raise or not change purchase intent.
Which Platform Leads AI Advertising Revenue?
Meta. Its AI ad infrastructure passed a $60 billion annual run rate. Total ad revenue of roughly $243.5 billion also puts Meta ahead of Google in global digital ad share for the first time.
Sources And Further Reading
- Research and Markets: AI in Advertising Market Report 2026
- Grand View Research: Artificial Intelligence in Marketing Market
- eMarketer: Worldwide Ad Spending 2026
- PPC Land: US AI Advertising Forecast Coverage
- Dentsu: Global Ad Spend Forecast 2026
- Meta Newsroom: AI Drives Performance 2026
- Marketing Dive: Meta AI Ad Infrastructure Run Rate
- AdExchanger: Google AI Max Adoption And Migration
- IAB: The AI Ad Gap Widens 2026
- Canva: Marketing And AI Report 2026
- eMarketer: Agentic Ad Buying Standards
- INMA: Advertising Enters The Agentic Era
- Spider Labs: 2026 Ad Fraud White Paper
- Statista: Ad Spend Lost To Invalid Traffic
- eMarketer: Generative AI Consumer Adoption 2026

About the author

Jordan Blake
A digital advertising specialist with years of experience in optimizing ad spend and leveraging promotional credits across platforms like Google Ads, Meta Ads, and more.
Similar Posts


Spend $200 → Get $200
Spend $500 → Get $500
Spend $1,000 → Get $1,000
Spend $4,000 → Get $4,000
Spend $6,000 → Get $6,000
Leave a Reply