TikTok Ads Statistics 2026: 1.59B Ad Reach at $1 a Click
Author: Jordan Blake

A click on TikTok still costs about a dollar. On Google Search, that same click runs roughly three times higher. That single gap explains why TikTok ad revenue is closing in on $39 billion this year while 8.7 million businesses fight for space in the auction.
2026 reshuffled the deck. The US ownership deal closed in January and took the ban risk off the table for good. TikTok Shop blew past $84 billion in global GMV. Ad reach now stretches to roughly 1.59 billion people, close to 28% of everyone online.
But headline numbers do not build a media plan. What you need is what a CPM costs in your vertical today, which formats convert, and where the auction gets ugly.
That is what this page is. We have run paid campaigns across the major platforms for seven years, and every benchmark below gets sense-checked against live accounts before it goes on the page. Where the trackers disagree, we say so and give you our own call.
Costs, reach, formats, TikTok Shop, and what we expect for the rest of the year. Let’s get into it.
Key TikTok Numbers Worth Pinning to Your Wall
Before we go deep, here are the figures we keep coming back to when planning client budgets in 2026:
AdCredits Expert read: Most stats pages parrot the same numbers. We run live TikTok accounts every week, so we care less about the headline revenue figure and more about what it costs you to get a click today. That is where this piece earns its keep.
Why You Can Trust These TikTok Figures
A quick note on where these numbers come from, because it matters. We have run paid campaigns across major ad platforms for seven years. Our day job is helping advertisers claim ad credits and get more out of every dollar of spend.
So this piece is not a page scraped from ten other pages. Every benchmark here gets sense-checked against live accounts we manage, then cross-read with the outlets we list at the end.
Where sources disagree, and they often do on TikTok, we say so plainly. We give you the reported range, then add our own call rather than pretending one figure is gospel. Forecasts on a platform moving this fast are always a judgement, not a fact.
One rule guides the whole page. If a number would not change how we plan a client budget, we left it out. What stays is what we actually use.
TikTok Ad Revenue: Following the Money in 2026
Revenue tells you where advertiser confidence sits. And confidence in TikTok is high again. Global TikTok ad revenue growth has been ferocious since 2020, moving from a rounding error to a top-tier paid channel in six years flat.
Forecasts diverge a little. WARC and eMarketer land near $34.8 billion for 2026. Other trackers push the global figure closer to $44 billion once TikTok Shop ad placements are counted. We sit in the middle. Our call puts full-year 2026 global ad revenue near $39 billion.
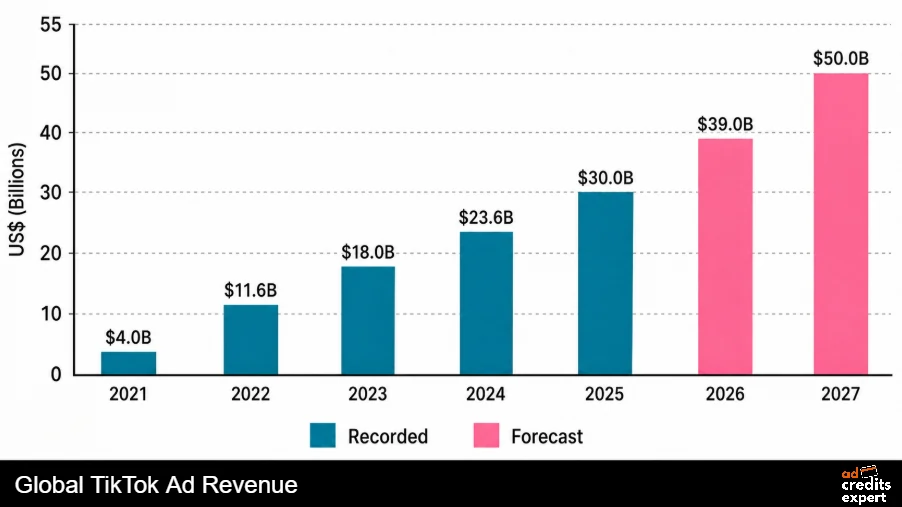
Here is the full year-on-year picture as we read it:
| Year | Global Ad Revenue | Year-on-Year Growth |
|---|---|---|
| 2021 | $4.0 billion | +100% |
| 2022 | $11.6 billion | +190% |
| 2023 | $18.0 billion | +55% |
| 2024 | $23.6 billion | +31% |
| 2025 (recorded) | Around $30 billion | +27% |
| 2026 (our call) | Around $39 billion | +30% |
| 2027 (our call) | Around $50 billion | +28% |
The 190% jump in 2022 was a one-off. Nothing repeats a base that small. What matters now is the steady 27% to 30% band. A channel adding a third of its revenue every year, at this scale, is rare air.
The United States remains the single richest market. US ad revenue for 2026 lands somewhere between $12 billion and $17 billion, with eMarketer sitting at the higher end. We lean conservative and pencil in around $13 billion for the full year.
The US Ownership Deal and What It Does to Your Budget
This is the freshest and most important shift, so we will not bury it. TikTok closed its US ownership deal on 22 January 2026. Oracle, Silver Lake and MGX hold a combined 50%. Existing ByteDance investors keep around 30%, and ByteDance itself retains 19.9%.
A new US board now oversees data and moderation, and the recommendation engine gets retrained on US user data. For advertisers, one thing changed above all else. The ban risk that froze planning for two years is gone.
Straight from the accounts we run: Several advertisers we work with paused TikTok spend during the limbo. That thinned the auction and briefly cooled costs. We expect that soft-pricing window to close fast as paused budgets pile back in. If you have been sitting out, the cheap seats will not last.
How Many People You Can Actually Reach
Reach is the reason brands keep circling back. TikTok now claims one of the largest addressable audiences in paid social.
In the United States, counts vary by method. Most credible reads put the US base between 136 million and 170 million users. Either way, it stays the largest single-country market by ad value.
One caveat we always flag to clients. Reach means people you could target, not people who will act. Treat the 1.59 billion as a ceiling, then build from qualified audiences down.
Who Is Scrolling: Audience and Demographic Data
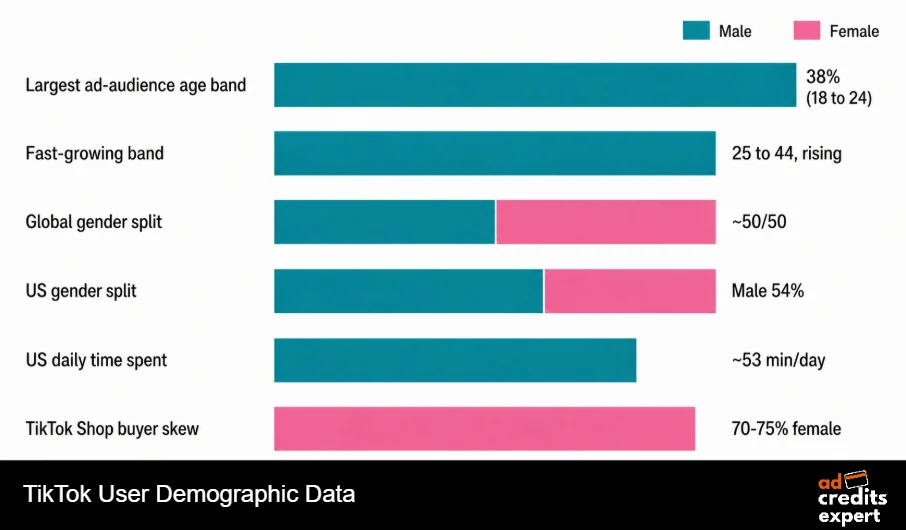
The old “Gen Z dance app” line is dead. TikTok has aged up hard, and the buying power has aged with it.
| Demographic | 2026 Data Point |
|---|---|
| Largest ad-audience age band | 18 to 24, near 38% of the ad audience |
| Fast-growing band | 25 to 44, rising every year |
| Global gender split | Close to even, a slight female lean worldwide |
| US gender split | Male share flipped ahead, around 54% |
| Average time spent | Around 55 to 58 minutes per day globally |
| US daily time spent | Roughly 52 to 54 minutes per day |
| App opens per day | About 10 to 19 sessions per user |
| TikTok Shop buyer skew | 70% to 75% female purchasers |
The gender picture splits by region. Worldwide the base leans slightly female. In the US, the male share nudged ahead of women in the last two years, a clear flip from 2023.
Time spent matters more than most advertisers admit. Nearly an hour a day of attention gives your creative room to breathe and repeat. That single habit drives most of the platform’s ad value.
Regional Reach: Where the Real Growth Sits
Reach is not spread evenly, and that shapes where the budget works hardest. Southeast Asia carries the heaviest audience, near 272 million users, and acts as the commerce heartland. Latin America follows close behind at around 356 million.
Europe crossed 200 million monthly users during 2026. The United States stays the richest by ad value, even though it is far from the largest by headcount.
Penetration tells a sharper story than raw counts. TikTok ad reach touches near 58% of the US population and around 37% globally. Some markets run far hotter, with the UAE reaching well past its adult base through heavy overlap.
The split matters for planning. Southeast Asia behaves like a shopping utility woven into daily habits. The US, by contrast, is the high-value growth market where creator-led selling drives the numbers. We plan those two regions with different playbooks, never one blanket approach.
TikTok Ad Spend by Industry: Who Is Actually Buying
Spend is not spread flat across sectors either. A handful of categories pour money in, and they tend to be the visual, impulse-friendly ones. TikTok ad spend by industry leans heavily toward the categories where a short clip can sell.
Technology, cosmetics and toiletries, and clothing sit at the top of the advertiser table. These consumer-facing sectors thrive where visual demonstration and quick emotion drive the sale.
Two adoption figures frame the mood well. Businesses now park around 15% of their marketing budgets on TikTok. And roughly 81% of agencies planned to raise TikTok investment heading into the year.
Content demand shows where attention pools, which is where smart advertisers follow. Ranked by hashtag volume, the biggest content buckets are:
Beauty punches above its view count when it comes to sales. The category leads TikTok Shop by a wide margin, which is why beauty brands treat the platform as a primary channel, not a test.
Advertiser Adoption Keeps Widening
The advertiser base is broadening fast, and that is the quiet story behind the revenue curve. Growth is not just more users. It is more brands spending more per campaign.
Here is the gap we find most telling. Only around a quarter of marketers actively run TikTok campaigns. So plenty of room remains for early movers to win cheap reach before the crowd piles in.
Small and mid-sized advertisers are the fastest-growing slice. The self-serve tools lowered the barrier, and credit offers lowered it further. That mix keeps pulling first-time advertisers onto the platform every month.
What TikTok Ads Cost in 2026
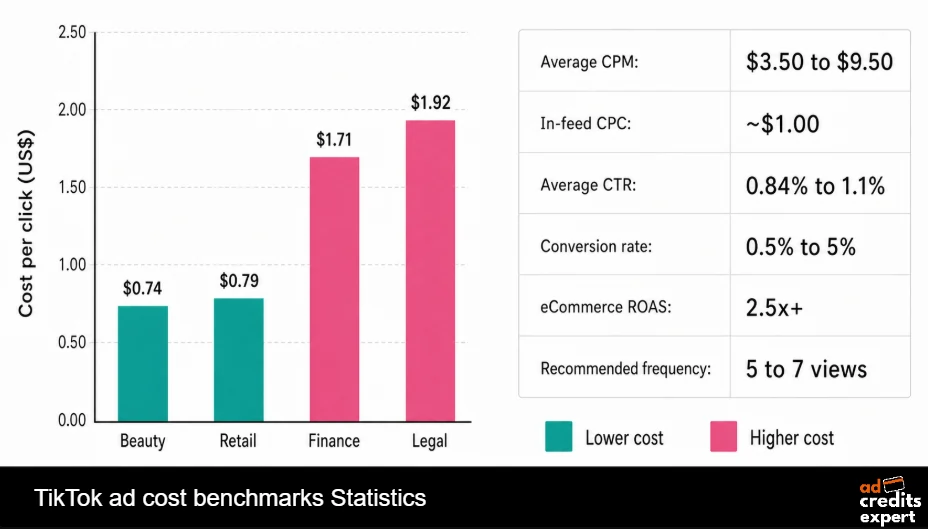
Now the part every advertiser actually opens the page for. Cost. These are the TikTok ad cost benchmarks we see across live accounts and third-party datasets in 2026.
| Metric | 2026 Benchmark | Notes |
|---|---|---|
| Average CPM | $3.50 to $9.50 | US inventory runs at the top end |
| In-feed CPC | Around $1.00 | Roughly a third of Google Search CPC |
| Average CTR | 0.84% to 1.1% | Native creative lifts this fast |
| Conversion rate | 0.5% to 5% | eCommerce sits mid-band, near 1.9% |
| eCommerce ROAS benchmark | At least 2.5x | Strong accounts clear 4x and up |
| Recommended frequency | 5 to 7 views per user | Past 6, CTR drops and fatigue kicks in |
The cost per thousand impressions stays on TikTok’s calling card. Broad reach here still undercuts Meta by a wide margin. That gap is the whole reason cost-conscious advertisers keep a TikTok line in the plan.
Cost splits sharply by industry. Beauty and retail win the cheapest clicks. Regulated verticals pay a heavy premium.
Credits corner: A cheap CPC still burns cash while you learn. This is exactly why we chase ad credits. A first-spend match, like the TikTok For Business credit offers we track, lets you fund the 30-day learning window without draining your own budget. Test on house money, scale on yours.
Festive-Period Cost Pressure and Auction Heat
Costs do not sit still across the year. Two forces push CPMs up in 2026. Advertiser demand keeps rising, and TikTok Shop keeps pulling more brands into the auction.
The festive shopping stretch is the sharpest squeeze. US CPMs during the year-end rush can climb by more than 30% above the annual average. Plan cash flow for that spike rather than getting caught out by it.
One habit saves accounts real money. A moderate CPM rise while scaling is normal, since you move past the easiest audiences first. Panic is the wrong response there.
The real warning sign is different. Watch for a falling CTR paired with a rising CPM. That combination usually points to creative fatigue, and the fix is fresh video, not a bigger bid.
Ad Format Performance: Where the Clicks Come From
Format choice swings results more than most levers. Here is how each TikTok ad format performs in 2026.
| Ad Format | Typical Engagement or CTR | Best Job in the Funnel |
|---|---|---|
| TopView | 12% to 16% | Big-reach awareness on app open |
| Branded Hashtag Challenge | Around 8.5% | Participation and user content |
| Branded Effects | Around 8.2% | Playful brand interaction |
| Collection Ads | 6% to 8% CTR | Shoppable product carousels |
| In-Feed Ads | Around 5.4% | Mid-funnel workhorse |
| Video Shopping Ads | 4% to 6% CTR | Catalogue retargeting at scale |
TopView buys attention but costs the most. In-feed is the daily bread of performance accounts. Our advice rarely changes. Match the format to the funnel job, then let the data referee.
Spark Ads vs In-Feed: A Gap Worth Knowing
One format pairing deserves its own callout. Spark Ads, which boost real creator posts, quietly outperform standard in-feed video across the board.
The maths favours Spark most of the time. A higher click cost is easy to swallow when conversion jumps by nearly half. We run creator-sourced Spark units as a default for shopping accounts.
TikTok Shop: When Ads Meet the Shopping Cart
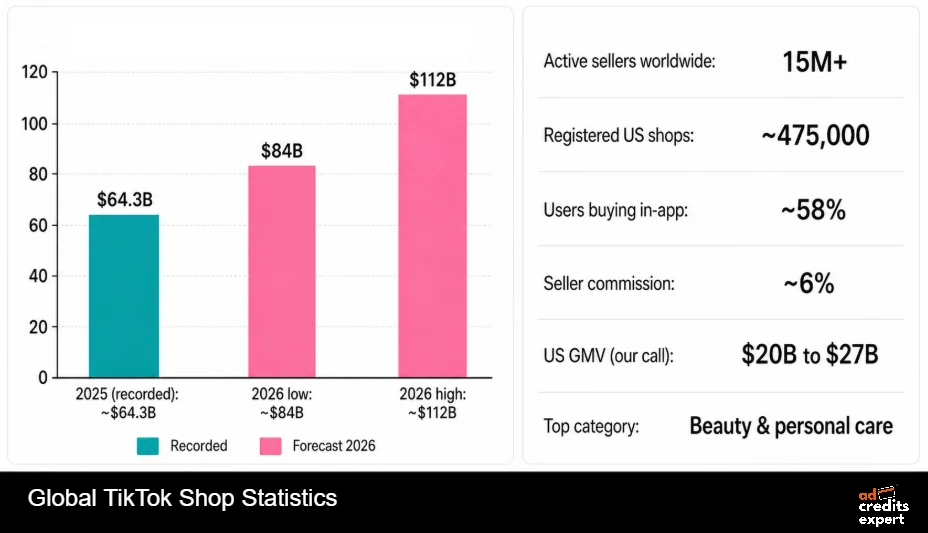
You cannot read TikTok Ads Statistics in 2026 without TikTok Shop. Ads and commerce now blur into one motion. People watch, tap and buy without leaving the feed.
| TikTok Shop Metric | 2026 Figure |
|---|---|
| Global GMV | $84 billion to $112 billion |
| 2025 global GMV (recorded) | Around $64.3 billion |
| US GMV (our call) | $20 billion to $27 billion |
| Active sellers worldwide | More than 15 million |
| Registered US shops | Around 475,000 |
| Users buying in-app | Close to 58% of the base |
| Seller commission | Around 6% per order |
| Top product category | Beauty and personal care |
Global GMV roughly doubled again in 2025 to around $64.3 billion. Our full-year 2026 read lands in the $84 billion to $112 billion band, with the US alone clearing $20 billion.
Two commerce numbers change how we build campaigns. Creators drive close to 78% of how shoppers first find products on Shop. And live shopping converts near 7.4%, roughly three times the platform average.
Affiliate creator content alone drives around 42% of Shop GMV. So the winning play is rarely a cold product ad. It is a trusted creator holding the product, boosted as a Spark unit.
Our numbers desk: We keep an internal attention index across the accounts we manage. TikTok’s value per impression runs well above Instagram Reels for brands posting native short video consistently. Shop simply turns that attention into checkout faster than any social channel we have measured.
Engagement: Why Each Impression Hits Harder
Reach without attention is noise. TikTok’s edge is that people actually watch. Engagement here dwarfs older platforms.
Engagement runs many times above Instagram and Facebook by follower count. Every impression on TikTok carries more weight, which is why a modest budget can still move real numbers.
One shift caught our eye. Videos of three to eight minutes now soak up a big slice of US watch time, up sharply from a couple of years back. Depth beats brevity when the hook holds.
Creative Signals That Move the Numbers
Creative is the biggest lever on this platform, bigger than budget in most accounts. The algorithm reads a few clear signals, and hitting them lifts every downstream metric. Strong short-form video creative beats a fat bid nearly every time.
The six-second mark is the one to chase. When more than 40% of your impressions reach six seconds, conversion tends to hold up well. Below that, the hook is failing in the opening beat.
Movement, curiosity or humour will out-pull polished branding on the feed. We rebuild the opening frame first whenever an account stalls. Nine times in ten, the hook is the culprit, not the offer.
Creator Partnerships and Influencer Spend
Creators are the engine, not a side quest. Brand dollars keep flowing from Instagram partnerships into TikTok collaborations.
The recall lift is the headline. Pairing an ad with a creator raises brand recall by around 27%. View-through rates can jump by up to 193%.
An independent Kantar study across roughly a thousand campaigns found 40% stronger brand recall on TikTok than on other placements. That is a third-party read, not a platform boast.
TikTok as a Search Engine, Not Just a Feed
Younger users treat TikTok as a search bar. So ads and organic content increasingly compete on keywords, not just creative flair. Getting found now sits alongside getting clicks.
The algorithm reads text hard. Keywords in the first three seconds of on-screen text and voiceover carry the most weight for ranking. Repeating a key phrase across the caption, the audio and the on-screen copy signals relevance.
What this means for spend is simple. Treat your video captions like SEO copy. A clip that ranks for a buyer query keeps earning views long after the paid push ends, which stretches every pound of budget.
ROI and Buying Behaviour: Does It Actually Sell?
Attention and cheap clicks mean little without sales. Here the platform holds up well.
That 52% figure deserves a second look. Half of TikTok-driven purchases trace back to TikTok alone. So last-click models routinely undercount the platform’s true contribution.
Ad Tolerance: People Do Not Hate These Ads
Ad fatigue haunts every channel. TikTok is the rare place where users tolerate, sometimes enjoy, the ads. A 2026 Kantar read across 27 markets found 41% of users happy to accept advertising in exchange for free content.
Nearly four in ten people being open to ads is a green light. Native units that entertain will outrun anything that interrupts. Design for the feed, not against it.
TikTok vs Meta vs YouTube: A Quick Scorecard
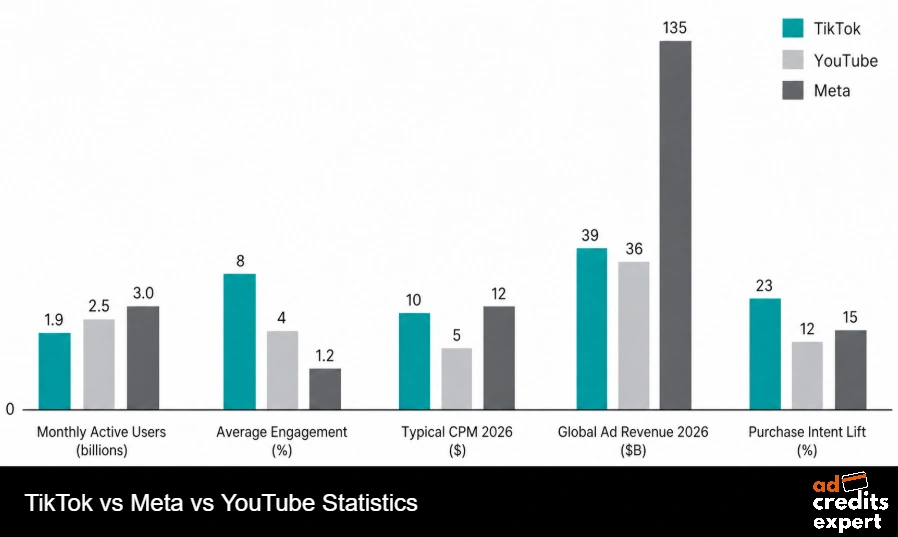
No channel wins on every metric. Here is how the big three stack up on the numbers that shape budget calls.
| Metric | TikTok | YouTube | Meta |
|---|---|---|---|
| Monthly active users | Around 1.9 billion | Around 2.5 billion | 3 billion plus |
| Average engagement | 3% to 8% plus | 0.5% to 4% | 0.6% to 1.2% |
| Typical CPM (2026) | $3.50 to $10 | Low, video-led | Around $12 plus |
| Global ad revenue (2026) | Around $39 billion | Around $36 billion | $135 billion plus |
| Purchase intent lift | Around 23% | Around 12% | 10% to 15% |
The pattern is clear. TikTok leads on engagement and purchase intent. Meta and YouTube still win on raw scale. Smart plans use TikTok to find and convert new buyers, then lean on Meta for volume.
What We Expect Across the Rest of 2026
Time for our forward calls. These come from what we see across the accounts we manage, mixed with the wider data.
Our closing view for 2026. TikTok is no longer an experiment you bolt on. The question stopped being “should we test TikTok”. It became “how much of our Meta and YouTube budget moves across”.
What we tell advertisers: Fund the learning phase with credits, run creator-led Spark units, and judge TikTok on 7-day click data, not last click. Do those three things and the numbers on this page start working for you rather than against you.
TikTok Ads Statistics 2026: Frequently Asked Questions
How much is TikTok ad revenue in 2026?
Global TikTok ad revenue lands between $34 billion and $44 billion for 2026, depending on the tracker. Our own call sits near $39 billion. The United States alone contributes somewhere between $12 billion and $17 billion.
What is the average cost of TikTok ads in 2026?
Average CPM runs from $3.50 to $9.50, with US inventory at the top end. In-feed cost per click sits near $1.00, still cheaper than Meta and far below Google Search. Beauty and retail win the lowest click costs.
How many people use TikTok in 2026?
TikTok carries close to 1.92 billion monthly active users and around 1.12 billion daily. Advertisers can reach roughly 1.59 billion people through the ad tools. The US base sits between 136 million and 170 million.
Is TikTok advertising worth it in 2026?
For most consumer brands, yes. TikTok pairs low CPMs with the highest engagement in social, plus a purchase intent lift near 23%. The US ownership deal also removed the ban risk that stalled planning for two years.
How big is TikTok Shop in 2026?
Global TikTok Shop GMV tracks between $84 billion and $112 billion this year, up from around $64 billion in 2025. More than 15 million sellers are active, and close to 58% of users have bought inside the app.
Which TikTok ad format performs best?
TopView drives the highest engagement at 12% to 16% for awareness. For performance and shopping, Spark Ads win, returning 2.4x higher CTR and around 44% better conversion than standard in-feed video.
Sources We Trust
These TikTok Ads Statistics blend our own campaign data with figures from the outlets below. Every link works at the time of writing.
- Statista TikTok advertising revenue worldwide
- eMarketer TikTok US ownership and ad revenue outlook
- WARC Global ad spend forecast
- DataReportal Digital 2026 global and platform reports
- DemandSage TikTok ad revenue by country
- Sprout Social TikTok usage and engagement data
- WebFX TikTok marketing benchmarks 2026
- Influencer Marketing Hub Creator engagement benchmarks
- Kantar Media Reactions ad tolerance and recall studies

About the author

Jordan Blake
A digital advertising specialist with years of experience in optimizing ad spend and leveraging promotional credits across platforms like Google Ads, Meta Ads, and more.
Similar Posts



Spend $200 → Get $200
Spend $500 → Get $500
Spend $1,000 → Get $1,000
Spend $4,000 → Get $4,000
Spend $6,000 → Get $6,000
Leave a Reply