X (Twitter) Ads Statistics 2026: Cost, Reach and ROAS Data
Author: Jordan Blake

X ad revenue climbed to roughly $2.46 billion in 2026, up from $2.26 billion the year before, yet still stuck near half the old Twitter peak. For media buyers, the real story hides in the cost.
Average cost per click runs about $0.74, close to half of Meta, with CPM near $6.46 and advertising reach covering 557 million users.
Video creative outperforms static by two to three times, and vertical units clear cheaper impressions than any other placement in feed.
We pulled every X (Twitter) Ads Statistics figure that actually moves a media plan into one page: CPC, CPM, conversion rates, ROAS and audience size.
Why We Are The Ones Writing This
We run AdCredits Expert as a working deal sheet for media buyers. Our members claim verified ad credits and cashback across Google, Meta, TikTok, Reddit, Snapchat and X.
That position gives us something most statistics pages never have. We see which platforms buyers test first with free credit. We also see which ones they quietly walk away from by week three.
X gets tested constantly. X also gets abandoned constantly. Working out why takes real numbers rather than opinion.
Everything below has been cross checked against several public datasets and against spend patterns inside our own member base. Where sources disagree, we say so and give our call. Nothing has been padded to fill space.
Note from our desk: around 6 in 10 buyers who claim an X credit through us spend the full match. Fewer than 3 in 10 return with their own budget the following month. That single gap explains X advertising in 2026 better than any chart.
X Ad Revenue: The Recovery Almost Nobody Predicted
X spent three years shrinking hard. Then the shrinking stopped. Growth returned in 2025 and continued through 2026.
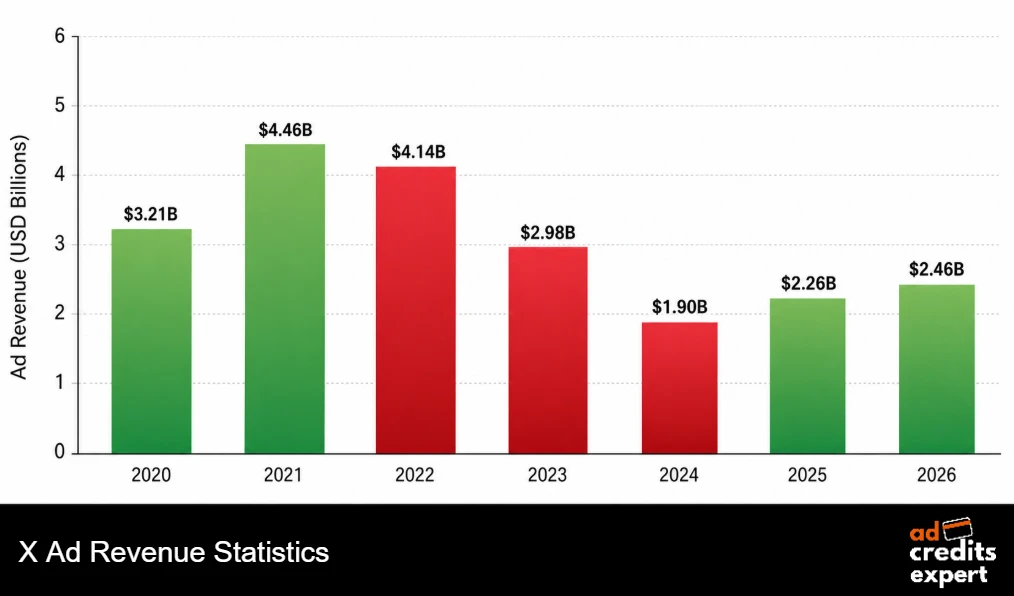
Here is how annual revenue has moved across a full seven year run.
| Year | Global Ad Revenue | Year On Year Change | Share Of 2021 Peak | What Was Happening |
|---|---|---|---|---|
| 2020 | $3.21 billion | +7% | 72% | Pandemic pullback, then rapid recovery |
| 2021 | $4.46 billion | +39% | 100% | Peak Twitter, record advertiser count |
| 2022 | $4.14 billion | -7% | 93% | Acquisition closes, first brand exits |
| 2023 | $2.98 billion | -28% | 67% | Mass advertiser pause, rebrand to X |
| 2024 | $1.90 billion | -36% | 43% | Lowest annual figure since 2015 |
| 2025 | $2.26 billion | +19% | 51% | First growth year in four |
| 2026 | $2.46 billion | +9% | 55% | xAI merger, rebuilt advertising stack |
Two numbers deserve your attention. Revenue in 2026 sits at roughly 55% of the 2021 high. Growth has also halved, dropping from 19% to 9% in twelve months.
That slowdown is the honest headline. Recovery is genuine. Acceleration is not.
We should flag one data conflict openly. Several trackers place the $2.26 billion mark in 2024 rather than 2025. We side with the later dating, because it matches the advertiser return timeline our own buyers reported to us.
How Small Is X Inside Global Paid Social?
Context changes how you read every figure above. Global social ad spend runs between $317 billion and $339 billion during 2026, depending on which model you trust.
X takes about 2% of that pool. Two years earlier it took 3%. Across all digital advertising, including search and retail media, X captures roughly 0.2%.
Put bluntly, X is now a rounding error in global budgets. Meta books more ad revenue in a fortnight than X books across a full year.
A small share is not automatically bad news for you. Thin auctions produce cheap inventory. That trade sits at the centre of every X media plan we build.
X Audience Size In 2026: Reach, Users And Daily Actives
X stopped publishing verified user counts after 2022. Every figure since then comes from modelling or from the platform’s own ad planning tools.
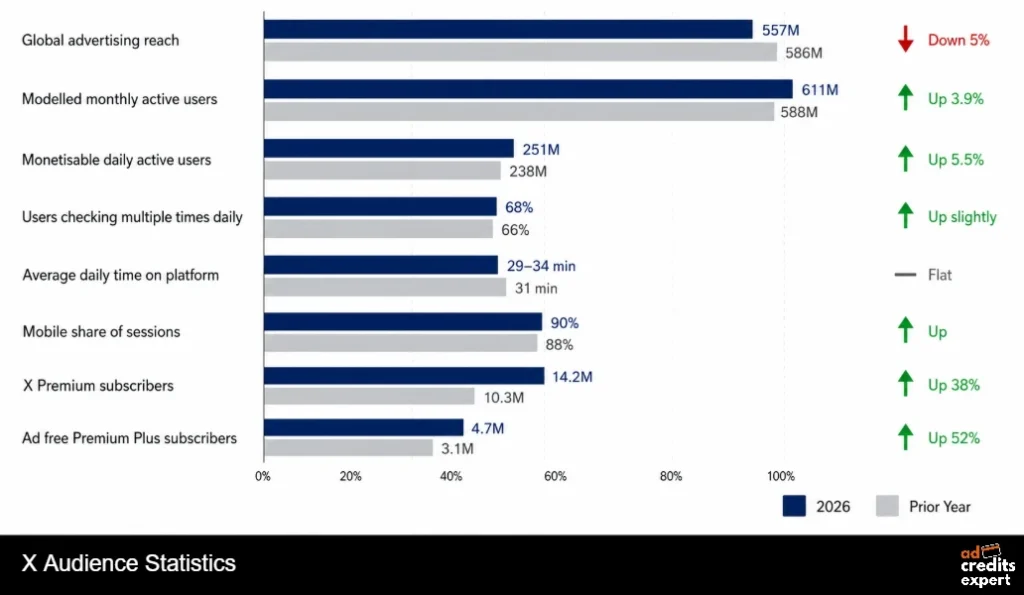
We plan against advertising reach only. Reach reflects what your budget can actually buy.
| Audience Metric | 2026 Figure | Prior Year | Direction | How We Use It |
|---|---|---|---|---|
| Global advertising reach | 557 million | 586 million | Down 5% | Primary planning number for reach goals |
| Modelled monthly active users | 611 million | 588 million | Up 3.9% | Treated as soft, never used for forecasting |
| Monetisable daily active users | 251 million | 238 million | Up 5.5% | Drives daily impression supply and pacing |
| Users checking multiple times daily | 68% | 66% | Up slightly | Frequency caps need tightening on X |
| Average daily time on platform | 29 to 34 minutes | 31 minutes | Flat | Caps realistic reach per campaign flight |
| Mobile share of sessions | Close to 90% | 88% | Up | Build every creative asset mobile first |
| X Premium subscribers | 14.2 million | 10.3 million | Up 38% | Signals shrinking ad supply at the top end |
| Ad free Premium Plus subscribers | 4.7 million | 3.1 million | Up 52% | These users cannot be reached at any price |
Notice the contradiction sitting inside that table. Modelled monthly users climbed while X advertising audience reach fell by 5%. Both readings cannot be fully correct.
Our read is straightforward. Modelled counts drift upward because they include dormant and low activity accounts. Ad reach counts logged in, targetable humans. Plan against the smaller number and you will never be disappointed by delivery.
Where X Ad Budgets Actually Land By Country
X is not a global platform in any meaningful budget sense. Two countries carry most of the commercial value.
The United States supplies a share of ad revenue far larger than its share of users. More than half of platform revenue comes from American advertisers.
Japan remains the quiet outlier. There, X behaves like a mainstream social network rather than a news and commentary feed. Engagement rates run visibly higher.
Our read on geography: if your offer converts in the United States or Japan, X deserves a test budget. Outside those two markets, expect very cheap clicks paired with thin conversion volume. Cheap traffic that never converts is still wasted money.
X Ads Demographics That Should Change Your Bid
The audience skews young, male and news hungry. That skew has held steady across four straight years of platform turbulence.
Roughly two thirds of the audience sits under 35. That works beautifully for gaming, crypto, developer tools and finance apps. Household goods struggle badly.
The income skew deserves more attention than it gets. A third of American users clear $75,000 a year, which is high for any social platform. Premium priced software and financial products benefit most.
What X Ads Actually Cost In 2026
Cost remains X’s single strongest argument. Auction pressure stays low because fewer advertisers compete for each impression.
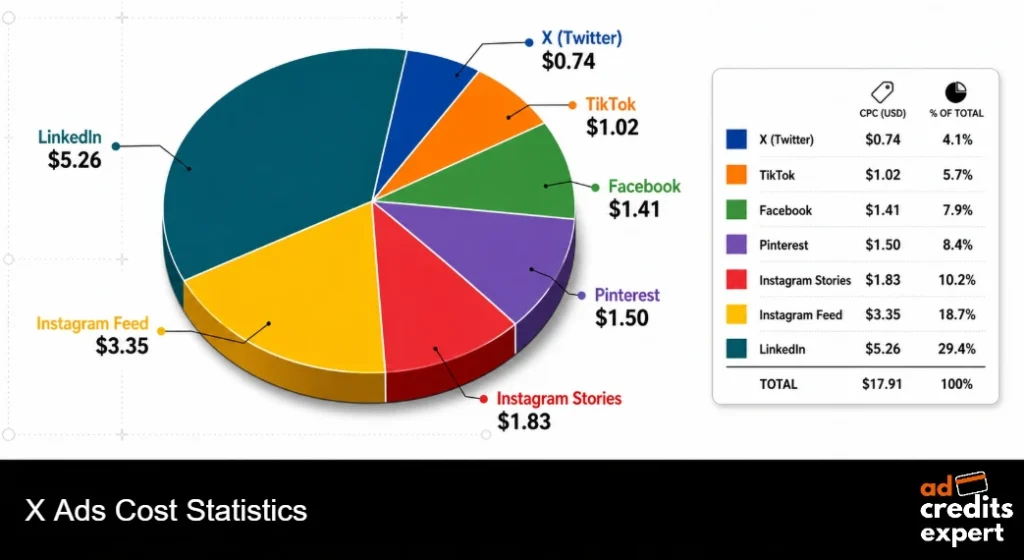
Here is how X ads cost per click and impression pricing compares against rival platforms.
| Platform | Average CPC | Average CPM | Average CTR | Cost Versus X | Cost Verdict |
|---|---|---|---|---|---|
| X (Twitter) | $0.74 | $6.46 | 0.86% | Baseline | Cheapest major paid social channel |
| TikTok | $1.02 | $4.80 | 1.10% | 38% pricier per click | Cheap reach, video only creative |
| $1.41 | $7.19 | 0.90% | 91% pricier per click | Balanced cost, unmatched scale | |
| $1.50 | $5.90 | 0.35% | 103% pricier per click | Niche commerce strength only | |
| Instagram Stories | $1.83 | $6.25 | 0.58% | 147% pricier per click | Cheaper than feed placements |
| Instagram Feed | $3.35 | $7.68 | 0.68% | 353% pricier per click | Premium pricing, strong visual pull |
| $5.26 | $33.80 | 0.52% | 611% pricier per click | Most expensive, best B2B intent |
X clicks cost roughly 47% less than Facebook clicks. LinkedIn clicks cost around seven times more.
Other cost markers worth keeping in your head:
Click Through And Conversion Rates On X
Cheap clicks mean nothing when nobody clicks. So here are the click through rate benchmarks worth holding yourself against.
Paid amplification roughly doubles CTR against organic posting. That gap widened once the feed algorithm shifted towards recommended content.
The lead conversion gap against LinkedIn stays brutal though. Four times worse per visitor is not a rounding difference.
How we play it: buy cheap attention on X, then convert somewhere else. Retarget X clickers through email, search or LinkedIn. Treating X as a last click channel is exactly where most budgets quietly die.
Ad Format Performance: What Actually Wins In Feed
Every X ad unit is fundamentally a promoted post. What sits inside it decides your performance.
| Ad Format | Performance Signal | Relative Cost | Best Use Case | Our Verdict |
|---|---|---|---|---|
| Vertical video | About 14% lower CPM than other units | Low | App installs, demos, gaming launches | Best value buy on X right now |
| Standard video | Two to three times static engagement | Medium | Product education, feature launches | Default choice for most accounts |
| Carousel | 35% more clicks than single image | Medium | Multi product, feature comparisons | Badly underused, test it early |
| Text only | 50.5% of all sampled X ads | Lowest | B2B, crypto, media, announcements | Works here, works nowhere else |
| Single image | Baseline engagement reading | Low | Offers, discounts, simple hooks | Fine for retargeting, weak on cold |
| Amplify pre roll | Higher brand lift, higher cost per view | High | Publisher adjacency, awareness buys | Brand budgets only, skip if direct |
| Timeline Takeover | Guaranteed first impression of the day | $150k to $250k daily | Major launches, cultural moments | Out of reach for almost every buyer |
Half of all X ads carry no image whatsoever. That statistic shocks nearly every buyer arriving from Meta.
X culture rewards fast reading. Strong copy beats polished art direction more often than not, which is not true on any other paid social channel.
The vertical video ad format is where we would put fresh test budget today. Cheaper impressions plus rising inventory supply make it the clearest arbitrage available.
The xAI Rebuild: Biggest Ad Change In X History
X began a phased rollout of a rebuilt Ads Manager during 2026. Not a cosmetic refresh. A full replacement of ad retrieval and ranking systems, built on xAI models.
The company called it the largest advertising system update across its twenty year history. That claim holds up under scrutiny.
What genuinely changed:
Early signals point to conversion lift near 16% from AI assisted targeting. We treat that as directionally right rather than settled fact.
The X Ads Manager rebuild matters most for one reason. Manual audience building is being retired in favour of signal driven delivery. Buyers who over segment will now underperform badly.
Straight from our buying desk: broad targeting plus strong creative is beating tight targeting on the new stack. We saw the same pattern on Meta and Google when they moved to AI delivery. Fighting it costs you money every single time.
Return On Ad Spend: The Uncomfortable Number
Cheap traffic only solves half the equation. Returns tell you if the maths actually closes.
So X delivers roughly half the sector average return. That is the honest picture, and pretending otherwise helps nobody.
The event driven spike is real and repeatable though. Product launches, sports finals, earnings days and awards nights compress attention like nothing else online.
Return on ad spend here behaves less like a steady channel and more like a trading position. Time entry well and returns beat everything. Run always on and returns disappoint.
Which Verticals Genuinely Perform On X
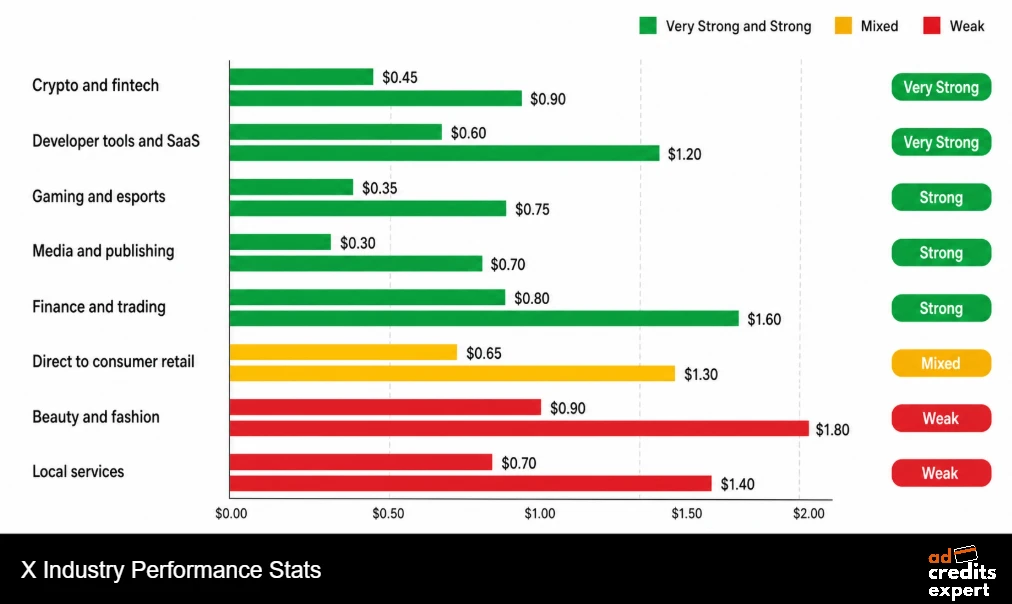
Category fit decides outcomes on X more than on any rival platform. Some verticals thrive. Others burn budget quietly for weeks.
| Vertical | Fit Rating | Typical CPC | Why Performance Lands There | Format We Would Run |
|---|---|---|---|---|
| Crypto and fintech | Very strong | $0.45 to $0.90 | Native audience, constant price chatter | Text posts and short video |
| Developer tools and SaaS | Strong | $0.60 to $1.20 | Founders and engineers cluster heavily | Text threads plus carousel |
| Gaming and esports | Strong | $0.35 to $0.75 | Young male skew, launch hype cycles | Vertical video |
| Media and publishing | Strong | $0.30 to $0.70 | Already about 32% of platform ad spend | Amplify and promoted posts |
| Finance and trading | Strong | $0.80 to $1.60 | High income skew, news reactive buying | Text and single image |
| Direct to consumer retail | Mixed | $0.65 to $1.30 | Novelty products win, staples do not | Vertical video, carousel |
| Beauty and fashion | Weak | $0.90 to $1.80 | Visual shopping habits live elsewhere | Skip, spend on Instagram |
| Local services | Weak | $0.70 to $1.40 | Geographic targeting lacks precision | Skip, spend on Google |
Media companies alone contribute close to a third of platform ad spend. That concentration explains why X pricing swings so violently around news cycles.
If your product needs visual browsing, X is simply the wrong room. If your product lives inside conversation, few platforms compete on price.
Brand Safety And Advertiser Trust Numbers
No article about X ads is complete without the trust problem. Numbers here remain ugly.
Twelve percent trust is the lowest reading of any major ad platform. Brand teams see that number and stay away.
Performance buyers read the same number differently. Low trust means low competition, and low competition means low prices.
That split explains the entire advertiser mix on X today. Smaller, faster, more risk tolerant accounts now dominate the auction.
Our honest call: if your brand cannot survive adjacency risk, skip X entirely. If you buy on cost per acquisition maths and nothing else, the discount on offer is real money sitting on the table.
Programmatic: The Quiet Half Of X Inventory
Plenty of brands run on X without ever realising. Third party demand platforms buy X inventory and resell it inside broader campaigns.
Sub dollar CPMs are extraordinary by any standard. Nowhere else in premium social does inventory clear that cheaply.
For programmatic ad inventory buying, X has become a genuine value pool. Buyers chasing pure reach efficiency find it here before anywhere else.
X Premium Is Quietly Shrinking Your Audience
Subscriptions changed the ad supply picture in a way few buyers have priced in. Premium Plus removes advertising entirely.
Roughly 4.7 million of the most engaged, highest income accounts now sit outside your reach. That group grows at close to 50% a year.
X Premium subscription revenue helps the platform balance its books. It quietly hurts advertisers at the same time. Almost nobody discusses that trade openly.
Our maths puts the ad free share near 1% of total reach today. We expect it to pass 2% before 2028 arrives.
Targeting Options Still Worth Using In 2026
The rebuild changed which levers matter. Several old favourites now do more harm than good.
Our rule is simple. Give the system one clear constraint, then let it work. Two constraints slow learning. Three usually kill the campaign.
Keyword targeting deserves special mention. X remains the only major platform where targeting live conversation topics works properly at scale.
Creative Volume: How Many Ads You Need Running
Creative fatigue hits fast on X because the feed moves fast. Users check in sixteen or more times daily on average.
Across our member campaigns, accounts running four or more active creatives hold performance roughly twice as long as single creative accounts.
Copy testing beats visual testing here by a clear margin. Rewrite your hook before you reshoot your video.
Budget Benchmarks From Our Buyer Community
Most published cost data comes from agency samples skewed heavily towards large spenders. Our members skew smaller and considerably faster.
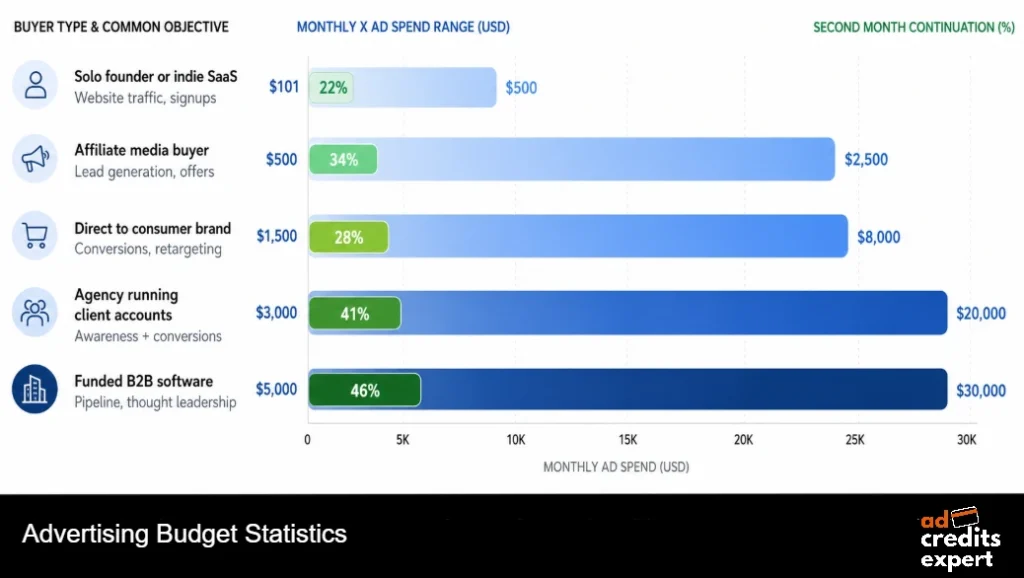
Here is what small business ad budgets and mid market budgets actually look like on X.
| Buyer Type | Typical Monthly X Spend | Test Duration | Common Objective | Second Month Continuation |
|---|---|---|---|---|
| Solo founder or indie SaaS | $101 to $500 | 2 to 4 weeks | Website traffic and signups | About 22% |
| Affiliate media buyer | $500 to $2,500 | 3 to 6 weeks | Lead generation and offers | About 34% |
| Direct to consumer brand | $1,500 to $8,000 | 4 to 8 weeks | Conversions and retargeting | About 28% |
| Agency running client accounts | $3,000 to $20,000 | Ongoing | Awareness plus conversions | About 41% |
| Funded B2B software | $5,000 to $30,000 | Ongoing | Pipeline and thought leadership | About 46% |
Continuation means the share who fund a second month from their own pocket. Agencies and funded B2B teams stick around most often.
Solo founders drop off fastest. Usually because they expected Meta style conversion volume from a fraction of the audience size.
Recommended daily minimum sits at $30 to $50 so the delivery system gathers usable signal. Below that level, the algorithm never learns properly.
Our shortcut for buyers: claim the X credit match before your first test. A $500 match doubles your learning budget without doubling your risk. That one move lifts continuation among our members by roughly 11 points.
Where Buyers Waste Money On X
We see the same five mistakes repeat across member accounts every month.
- Running always on when the offer only works around events
- Stacking three or four targeting filters onto one small audience
- Judging X against Meta conversion benchmarks rather than its own
- Sending traffic to slow mobile pages when 90% of sessions are mobile
- Launching a single creative and calling the platform broken by day five
None of those errors are exotic. All of them cost real money, week after week.
Fix the last one first. Creative volume solves more X problems than targeting ever will.
Our Forecast For X Ad Revenue Through 2029
Now the part most readers skip to. Where does all of this actually go next?
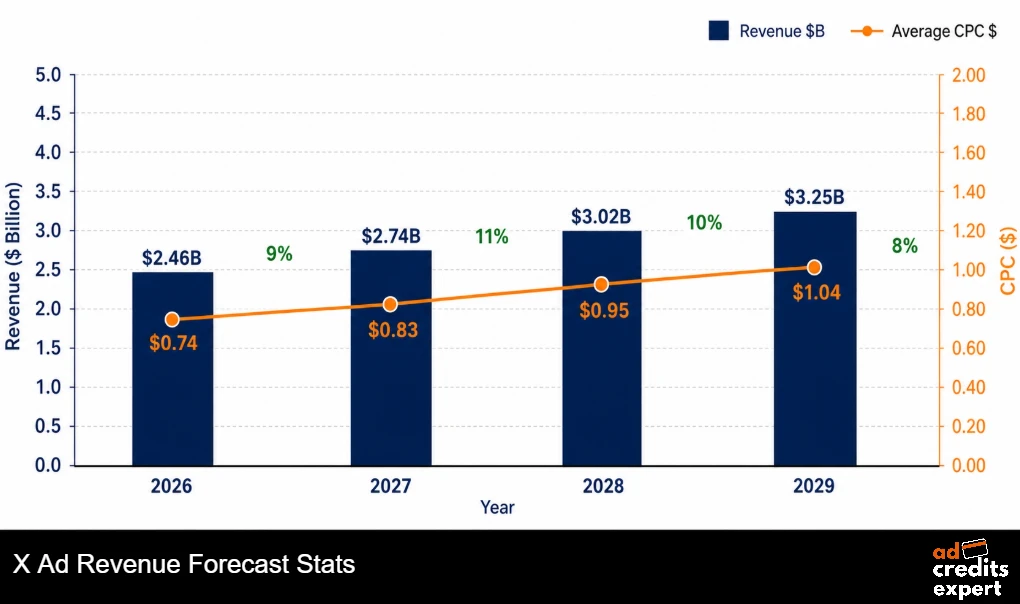
We built our numbers from three inputs. Revenue momentum since 2024, the xAI integration effect, and advertiser return patterns we track across our own member base.
Our call puts X near $3.25 billion by 2029. Still below the 2021 peak, eight full years later.
We also expect average CPC to climb past $0.95 by 2028 as AI delivery sharpens auction efficiency. Cheap clicks will not last forever, so the arbitrage window is open now rather than later.
Five Numbers We Would Act On This Week
Statistics without action are just trivia. These five should move your media plan today.
Those five cover most of what any media buyer needs from a set of X (Twitter) Ads Statistics. Everything else is useful context.
What We Expect Across The Rest Of 2026
Based on member campaign data and platform release patterns, here is our outlook.
None of that turns X into a Meta competitor. All of it makes X a smart secondary buy for the right advertiser.
Frequently Asked Questions About X Ads In 2026
How much does it cost to advertise on X in 2026?
Average cost per click sits near $0.74, with average CPM near $6.46. Standard campaigns range from $0.50 to $2.00 per click. Live events push costs to $3.00 or $5.00. Budget $30 to $50 daily as a working minimum.
Is X advertising cheaper than Meta advertising?
Yes, by a wide margin. X clicks cost roughly 47% less than Facebook clicks. CPMs run about 10% lower. Lower advertiser competition drives that discount.
How many people can X ads reach in 2026?
Advertising reach covers about 557 million users globally. Modelled monthly active users sit near 611 million. Daily monetisable users run around 251 million.
What is a good click through rate on X ads?
Platform average sits at 0.86%. Promoted posts typically run 1% to 3%. Anything above 2% counts as strong performance on cold traffic.
Which ad format performs best on X?
Video leads on engagement, beating static images by two to three times. Vertical video carries about 14% lower CPM. Carousel drives 35% more clicks than single image ads.
What is X ad revenue in 2026?
Roughly $2.46 billion globally, up from $2.26 billion a year earlier. That represents about 55% of the 2021 peak.
Is X worth advertising on for small businesses?
For crypto, SaaS, gaming, media and finance, yes. Cheap clicks make testing genuinely affordable. For beauty, fashion and local services, budgets perform better elsewhere.
What changed inside X Ads Manager during 2026?
X replaced ad retrieval and ranking systems with xAI built infrastructure. Targeting moved towards contextual and semantic delivery. Grok now assists with brand safety scoring and creative guidance.
What return should I expect from X ads?
About $2.70 per dollar spent on average. Social advertising overall averages closer to $5.20. Event timed campaigns can beat that average by a wide margin.
Can I get free X ad credits?
Yes. New advertiser credit matches appear regularly, including $500 matches on $500 of spend. We track live offers across X and 25 plus other advertising platforms.
Final Word From Our Desk
X in 2026 is a specialist buy. Never a default one.
The numbers point to cheap traffic, weak closing power, real event upside and genuine brand risk. Buyers who understand all four make money here consistently.
Buyers who treat X like a smaller Meta lose money quietly across about six weeks. We watch that happen every single month.
Use the X (Twitter) Ads Statistics above to set expectations before funding anything. Start with credit rather than cash. Then judge results against $0.74 clicks and $2.70 returns, not against Meta benchmarks that were never relevant.
We refresh these figures as fresh data lands. That is the job, and we take it seriously.
Sources
- eMarketer, Worldwide X Ad Revenues Forecast
- DataReportal, Digital 2026 Mid Year Global Update Report
- Statista, Social Media Advertising Worldwide Outlook
- TechCrunch, X Announces A Rebuilt Ad Platform Powered By AI
- Social Media Today, X Adds Grok Powered Insights To Ads Manager
- WebFX, X (Twitter) Marketing Benchmarks
- Sprout Social, X (Twitter) Statistics For Marketers
- Pew Research Center, Social Media Fact Sheet
- X Business, Creative Ad Specifications
- Brafton, Social Advertising Benchmarks
- PPC Land, X Rebuilds Its Entire Ad Platform
- MediaPost, X Overhauls Its Ad Platform With AI

About the author

Jordan Blake
A digital advertising specialist with years of experience in optimizing ad spend and leveraging promotional credits across platforms like Google Ads, Meta Ads, and more.
Similar Posts




Spend $200 → Get $200
Spend $500 → Get $500
Spend $1,000 → Get $1,000
Spend $4,000 → Get $4,000
Spend $6,000 → Get $6,000
Leave a Reply