PPC Statistics 2026: Inside the $1.27 Trillion Ad Spend Shift
Author: Jordan Blake
Paid media got bigger, pricier and a lot stranger this year. Global ad spend reaches $1.27 trillion in 2026, and digital swallows nearly 69% of it. Search alone pulls $218.3 billion worldwide. The average cost per click across search sits at $5.42, with conversion rate at 8.18%.
Cost per lead landed at $66.69, falling after five straight years of climbing. We buy media daily at AdCredits Expert. What follows is our own read, our own calls, and the traps we watch buyers walk into.
Straight from our media desk: we have spent seven years negotiating credits and tracking spend across 25+ ad platforms. Every figure below was checked against primary reporting before it went in. No recycled 2019 numbers dressed up as fresh.
Quick Numbers We Keep Pinned Above The Desk
Before the long tables, here are the PPC Statistics our team quotes most often on client calls. Memorise these and you can sanity check almost any paid media pitch that lands in your inbox.
Global Ad Spend Crossed $1.27 Trillion, And Digital Took Most Of It
Money kept flowing into paid channels through 2026 despite soft consumer demand. WARC puts worldwide spend at $1.27 trillion, up roughly 8% on last year. The United States stays the largest single market at $421.1 billion, helped along by midterm elections and a World Cup year.
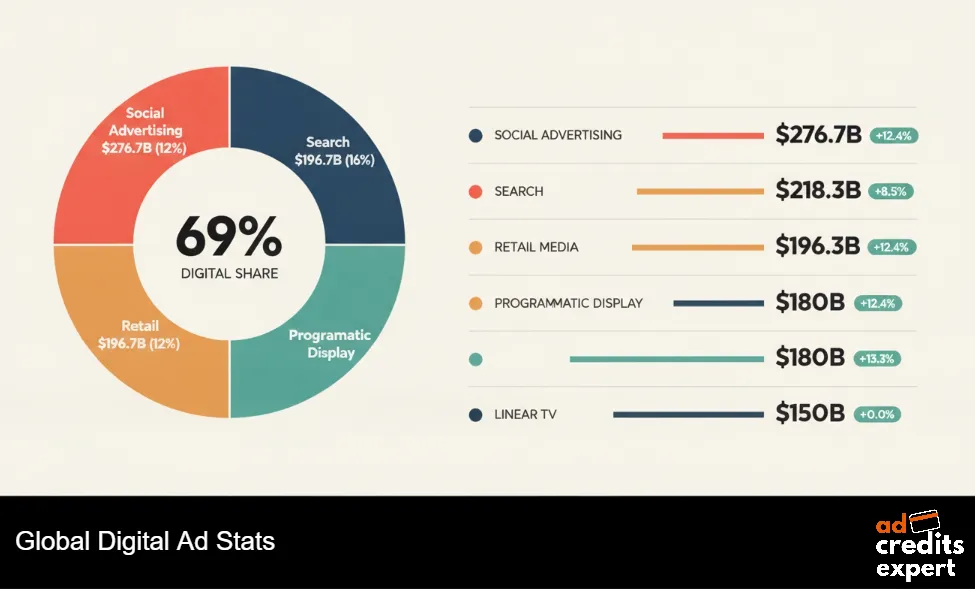
Digital now takes about 69% of every advertising dollar globally. Search, social and retail media absorb most incremental budget, while linear television flatlines. Our own deal flow mirrors that shift almost perfectly.
| Channel | 2026 global spend | Year on year change | Share of total ad spend | What we watch closely |
|---|---|---|---|---|
| Search advertising | $218.3 billion | +8.5% | Around 17% | Rising click prices, falling volume on informational queries |
| Social advertising | $276.7 billion | +12.4% | Around 22% | Short video formats and social commerce driving growth |
| Retail media | $196.7 billion | +12.4% | Around 16% | Amazon and Walmart taking almost all net new money |
| Connected TV | Fastest growing video line | +11.5% | Rising share of video | Premium inventory, patchy fraud controls in places |
| Programmatic display | $180 billion in the US | +13.3% | 97% of US display buys | Highest invalid traffic exposure of any channel |
| Linear television | Flat | 0.0% | Shrinking every year | Budget migrating to CTV and retail media |
| Digital total | Around $836 billion | +10% area | 68.7% of all spend | Concentration inside three platform owners |
Paid Search Spend: Two Numbers, One Honest Explanation
You will see two very different totals quoted for paid search this year. One camp says $218.3 billion. Another says $306 billion. Both get repeated as gospel, which confuses buyers who simply want to build a media plan.
The narrow figure counts classic search engine advertising only. The broader figure folds in retail media search placements, marketplace sponsored listings and app store ads. We use the narrow number for competitive planning and the wide one when clients ask how much keyword-driven inventory exists in total.
Our buyer’s note: when a vendor quotes a market size without saying what sits inside it, treat the pitch with suspicion. We always ask for the inclusion list before accepting any headline figure.
Average Cost Per Click Reached $5.42 Across Search
WordStream and LocaliQ analysed 13,474 US search campaigns across 23 industries running from April 2025 to March 2026. Blended average cost per click landed at $5.42, up modestly on last year.
Put that next to 2016, when the same annual report measured $2.32. Clicks have more than doubled in price across a decade. Inflation explains part of it, and auction density explains far more.
Legal services tops the table at $9.87 per click. Home improvement follows at $8.33, then dental at $8.00. At the cheap end, arts and entertainment clicks cost $1.63 and restaurants just $2.05.
Search Benchmarks By Industry: The Full 2026 Table
Averages hide more than they reveal, so here is the row-by-row view.
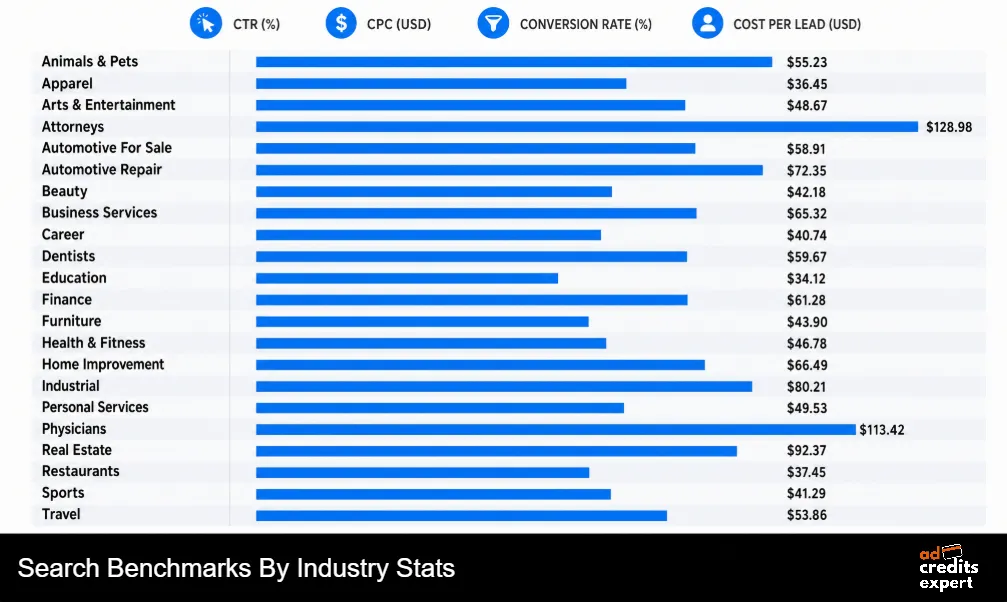
Read across, never down. A costly click paired with a strong conversion rate beats a cheap click that converts at nothing.
| Industry | Average CTR | Average CPC | Conversion rate | Cost per lead |
|---|---|---|---|---|
| Animals & Pets | 7.49% | $4.06 | 16.22% | $31.50 |
| Apparel, Fashion & Jewellery | 6.64% | $4.44 | 4.50% | $97.51 |
| Arts & Entertainment | 12.75% | $1.63 | 5.91% | $26.84 |
| Attorneys & Legal Services | 5.87% | $9.87 | 5.55% | $131.63 |
| Automotive, For Sale | 8.28% | $2.27 | 6.01% | $44.26 |
| Automotive, Repair & Parts | 5.56% | $4.35 | 15.51% | $29.96 |
| Beauty & Personal Care | 6.75% | $4.62 | 10.35% | $39.25 |
| Business Services | 6.10% | $5.87 | 4.85% | $93.69 |
| Career & Employment | 5.88% | $5.81 | 3.05% | $67.36 |
| Dentists & Dental Services | 5.66% | $8.00 | 10.67% | $72.97 |
| Education & Instruction | 7.56% | $4.81 | 13.14% | $77.48 |
| Finance & Insurance | 9.83% | $3.39 | 2.64% | $74.44 |
| Furniture | 6.57% | $3.97 | 2.99% | $106.70 |
| Health & Fitness | 5.81% | $6.17 | 6.94% | $67.36 |
| Home & Home Improvement | 6.47% | $8.33 | 8.05% | $90.92 |
| Industrial & Commercial | 6.57% | $5.87 | 8.20% | $75.19 |
| Personal Services | 7.16% | $7.17 | 12.34% | $54.60 |
| Physicians & Surgeons | 6.61% | $4.76 | 12.43% | $40.04 |
| Real Estate | 7.61% | $3.22 | 3.70% | $102.51 |
| Restaurants & Food | 6.83% | $2.05 | 8.05% | $30.57 |
| Sports & Recreation | 8.75% | $2.77 | 7.69% | $44.26 |
| Travel | 9.32% | $2.14 | 5.83% | $44.70 |
Conversion Rates Improved For 87% Of Industries
Here sits the most encouraging line in this year’s data. Conversion rate rose for 87% of measured industries, on top of gains recorded last year. Blended average conversion rate benchmarks now reach 8.18%.
Animals and pets leads at 16.22%. Automotive repair follows at 15.51%, then education at 13.14%. Finance and insurance props up the bottom at 2.64%, which surprises nobody who has run a lending account.
Beauty and personal care posted the biggest annual jump, up 32.34%. Career and employment slid 29.42%, its second yearly drop in a row.
What we saw in member accounts: conversion gains clustered around advertisers who moved to value-based bidding. Buyers still optimising to raw lead count saw flat results, sometimes worse.
Cost Per Lead Fell For The First Time Since 2020
Blended cost per lead benchmarks came in at $66.69, a small annual decrease. That breaks a five-year run of increases, and it matters more than the headline suggests.
Legal remains the most expensive lead in search at $131.63. Furniture sits at $106.70 and real estate at $102.51. Arts and entertainment is the bargain of the year at $26.84.
Travel recorded the sharpest improvement, with lead costs down 39.35%. Beauty followed at 34.95% cheaper. Automotive and retail moved the other way, pressured by tariffs on physical goods.
Click Through Rate Held Firm While Market Averages Slipped
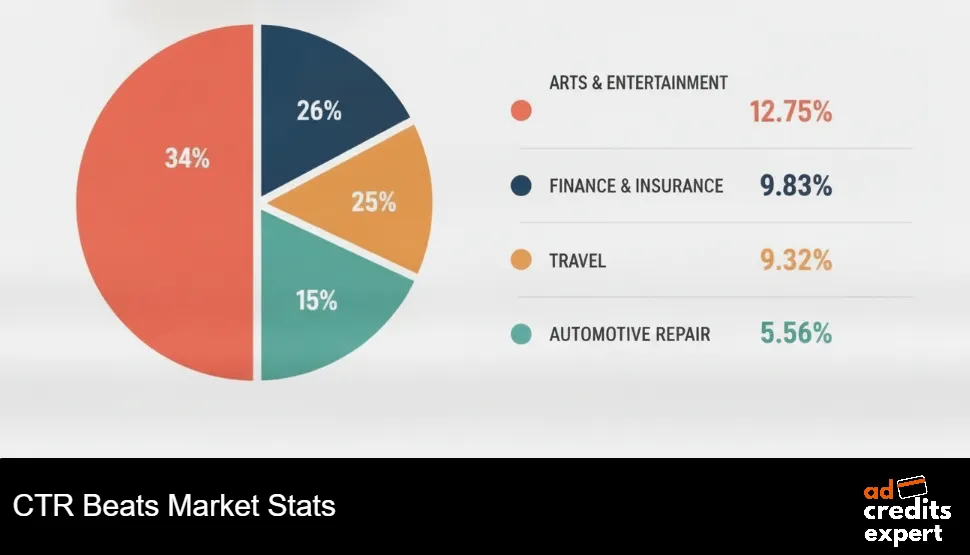
Average CTR across search advertising reached 6.64% in 2026. Compare that against 1.91% back in 2016 and the shift looks enormous. Better ad formats and machine-written assets did most of that work.
Arts and entertainment leads every industry at 12.75%. Finance and insurance follows at 9.83%, then travel at 9.32%. Automotive repair sits bottom at 5.56%.
Movement matters more than position, though. Education and instruction gained 31.71% year on year. Beauty added 18.21% and finance 18.01%. Health and fitness lost 19.08%, career and employment 10.50%.
Worth noting: managed accounts held CTR steady while broader market data showed decline. Optimisation work genuinely separates results now, more than at any point we have measured.
Return On Ad Spend: What A Dollar Actually Buys
Average return across paid search sits near $2 for every $1 spent, roughly 200%. Well-run accounts with tight tracking push that considerably higher.
Around 72% of advertisers still rank paid search as their highest-return channel. On commercial queries, sponsored results capture a majority of clicks, which explains why budgets keep growing despite rising prices.
Returns split hard by channel. DTC brands running blended prospecting and retargeting typically see 3x to 4x. Prospecting alone lands at 2x to 3x, while retargeting reaches 6x to 10x.
Where our members gain ground: credits applied at test stage lift effective return by 18% to 26% on early campaigns. Nothing beats free budget absorbing your losing creatives.
Google Still Owns Search, But Its Grip Loosened
Google holds roughly 90% of global search engine market share entering 2026. Annual advertising revenue sits near $296 billion, with search and associated properties contributing about $224.5 billion last year.
Scale like that never disappears overnight. Even so, Google’s share of United States search ad spending slipped below the 50% line, while Amazon captured around 22.3%. Buyers treating Google as the whole of search are already behind.
Microsoft Ads Remains The Cheapest Click In Search
Microsoft Advertising revenue should reach $19.53 billion in 2026, up 12.2%. Search and news advertising grew 21% across the last full fiscal year, the fastest rate since Copilot integration began.
Average CPC on Bing sits near $1.54, roughly 33% to 40% below Google. Average CTR runs about 2.83%. Advertisers still send only around 6% of paid search budgets there, which stays the biggest arbitrage in search.
Meta Ad Costs: Impressions Up, Efficiency Holding
Meta stays the biggest single line in most social budgets. Median CPM across industries hit $13.48, median CTR 2.19%, and median conversion rate 1.57%. Median return on ad spend came in at 1.93.
Global median CPC held near $1.11 across a full year of tracking. Traffic objectives ran about $0.70 per click, lead generation closer to $1.92. Twelve of fifteen verticals improved returns even as impression costs rose.
Advantage+ shopping campaigns delivered around 32% lower acquisition costs than manually built equivalents across e-commerce accounts.
TikTok Ads Undercut Every Major Feed On Price
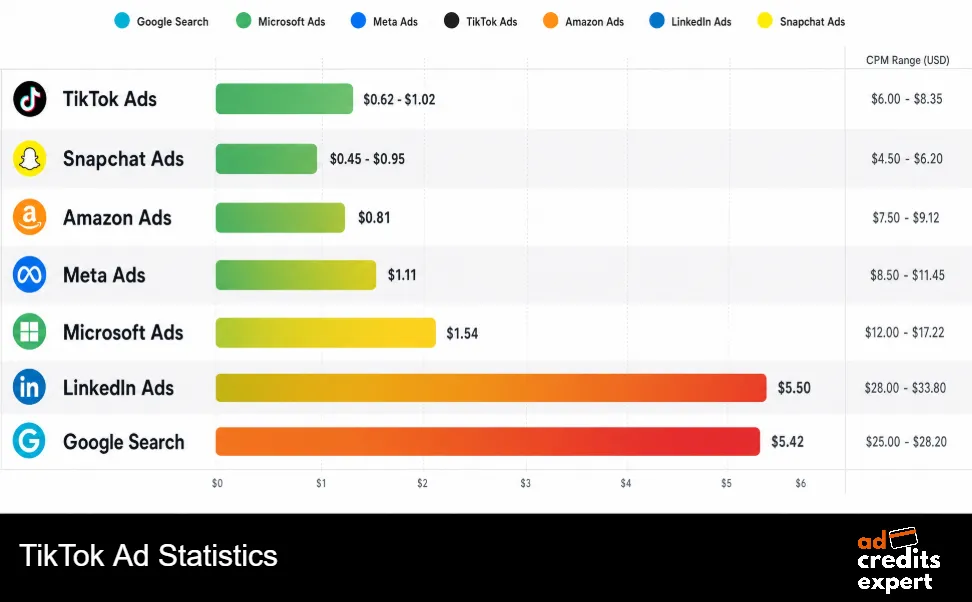
TikTok remains the cheapest large-scale feed for buyers who can produce native video quickly. Cross-industry in-feed CPC sits near $1.02, and one dataset covering 3,127 campaigns put median CPC at $0.62.
CPM planning ranges run $4 to $13 depending on vertical and season. Global TikTok ad spend grew 32% year on year, and United States revenue tracks toward $12 billion this year.
Spark Ads matter more than most buyers realise. Click through rates run about 1.92 times standard in-feed placements, and acquisition costs land roughly 28% lower.
| Platform | Typical CPC 2026 | Typical CPM 2026 | Intent level | Best fit | Our efficiency note |
|---|---|---|---|---|---|
| Google Search | $5.42 blended | Not CPM led | Highest | Lead generation, high-ticket services | Price of certainty, still worth paying in most verticals |
| Microsoft Ads | $1.54 | Not CPM led | High | B2B, SaaS, professional services | Best cost per qualified lead we track anywhere in search |
| Meta Ads | $1.11 median | $13.48 median | Medium | DTC, retargeting, broad reach | Creative volume beats endless audience tinkering |
| TikTok Ads | $0.62 to $1.02 | $4 to $13 | Low to medium | Product demand, Gen Z, impulse buys | Cheapest scale available when creative refreshes weekly |
| Amazon Ads | $0.81 | Varies by format | Very high | Marketplace sellers, DTC launches | Conversion rates near 9.47% on sponsored products |
| LinkedIn Ads | Around $5.50 | $20 to $45 | High for B2B | Enterprise software, recruiting | Premium priced, defensible on high contract values |
| Snapchat and Pinterest | Sub $1 typical | Single digit | Low to medium | Visual products, younger buyers | Underbought channels where credits stack easily |
Amazon Ads: The High Intent Click Few Buyers Talk About
Amazon quietly runs one of the strongest conversion environments in paid media. Average CPC sits around $0.81, with sponsored product conversion rates near 9.47%.
Behind those numbers sits 40.6% of all United States e-commerce sales. Shoppers arrive with a wallet open rather than a question in mind, which changes click economics completely.
Non-endemic advertisers noticed. Automotive, financial services and travel brands now account for roughly 23.8% of Amazon ad spend, up from about 9.1% three years ago.
Retail Media Ad Spend Became The Third Pillar
Retail media stopped being a side bet somewhere around last year. Worldwide spend reaches $196.7 billion in 2026, up 12.4%, and accounts for roughly 16% of all advertising money.
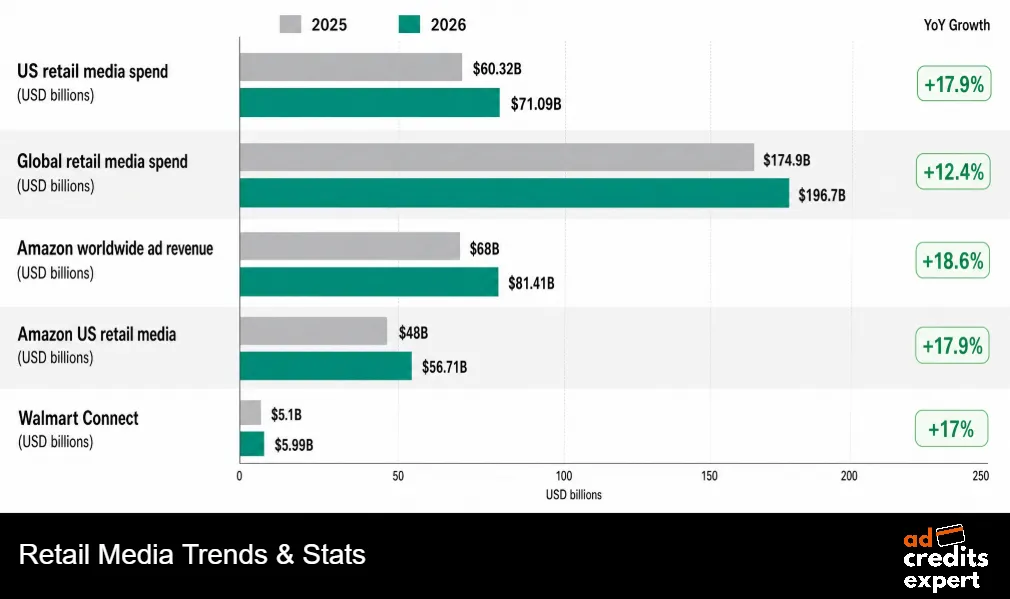
United States advertisers put $71.09 billion into retail networks this year, against $60.32 billion last year. Amazon takes $56.71 billion of that. Walmart Connect, sitting second, takes $5.99 billion.
Concentration remains the part most allocation debates skip. Amazon and Walmart absorb around 89% of every net new retail media dollar in 2026.
| Retail media metric | 2025 | 2026 | Change | Why buyers should care |
|---|---|---|---|---|
| US retail media spend | $60.32 billion | $71.09 billion | +17.9% | Fastest growing large channel across the US market |
| Global retail media spend | $174.9 billion | $196.7 billion | +12.4% | Now around 16% of worldwide ad budgets |
| Amazon worldwide ad revenue | Around $68 billion | $81.41 billion | +18.6% | Outgrowing both Meta and Google on percentage terms |
| Amazon US retail media | Around $48 billion | $56.71 billion | +17.9% | More than 75% of all US retail media spend |
| Walmart Connect | Around $5.1 billion | $5.99 billion | +17% area | Only credible challenger operating at national scale |
| Active retail networks worldwide | Around 260 | 277 plus | Rising | Most carry too little volume to justify a test budget |
| Amazon and Walmart share of new spend | Around 85% | 89% | +4 points | Long tail networks losing the growth fight badly |
AI Overviews Cut Paid Click Through Rate Hard
This ranks as the single biggest change to search economics we have tracked in seven years. AI Overviews appear on more than 17% of monitored SERPs, and one study of 21.9 million searches put prevalence above 25%.
Seer Interactive tracked paid click through rate on Overview queries falling from 19.70% to 6.34% across a fifteen-month window. Organic fared worse, dropping 61% on the same query set.
One finding deserves a highlighter. When a brand appeared inside the AI Overview itself, paid CTR ran about 91% higher than when it did not appear at all.
Our call on AI answers: Overviews mostly trigger on informational queries, around 36% of them, against 8% commercial and 5% transactional. Bottom-funnel keywords stay far safer than panicked forum threads suggest.
Ads Inside AI Chat: The First Real Numbers
OpenAI began testing advertising for free and lower-tier users in January 2026, reversing years of public resistance. Early trial data is now visible, and it reads as a mixed bag.
More than 600 advertisers joined the initial United States trial. CPMs ran near $50, roughly triple Meta’s average and close to broadcast sports pricing. Sample click through rate landed at 0.92% against about 6% on Google Ads.
Some trial participants spent just 3% of allocated budget. Minimum spend later dropped to $50,000 after reported annualised revenue hit $100 million inside six weeks.
Automated Bidding Now Controls Most Ad Budgets
Machine-run bidding stopped being optional. Smart Bidding and Performance Max together handle roughly 78% of all Google Ads spend in 2026.
Advertisers switching to automated strategies report around 20% more conversions at identical budgets, plus about 14% higher conversion rates on average. Microsoft’s automated strategies reportedly outperform Google equivalents by around 14% at lower volumes.
Automation also explains why lead costs fell this year while click prices rose. Machines buy fewer, better clicks. That trade only works when conversion tracking feeds them clean signals.
Account Basics Still Decide Who Wins The Auction
Automation did not kill fundamentals. Analysis of more than 15,000 Google Ads accounts found foundational setup driving a huge share of performance difference.
One number sticks with us. Adding a single negative keyword to a search campaign can triple conversion rates. Most underperforming accounts we audit have never built a proper exclusion list.
Three platform shifts pushed costs up this year, and each one punishes lazy setup:
Accounts that have not recalibrated budgets in twelve months are likely overspending by 15% to 25% per acquisition. We see that gap constantly during audits.
Invalid Traffic Is The Tax Nobody Budgets For
Now the uncomfortable section. Analysis of 105.7 billion programmatic impressions found a global invalid traffic rate of 20.64%. Roughly one impression in five shows fraud signals.
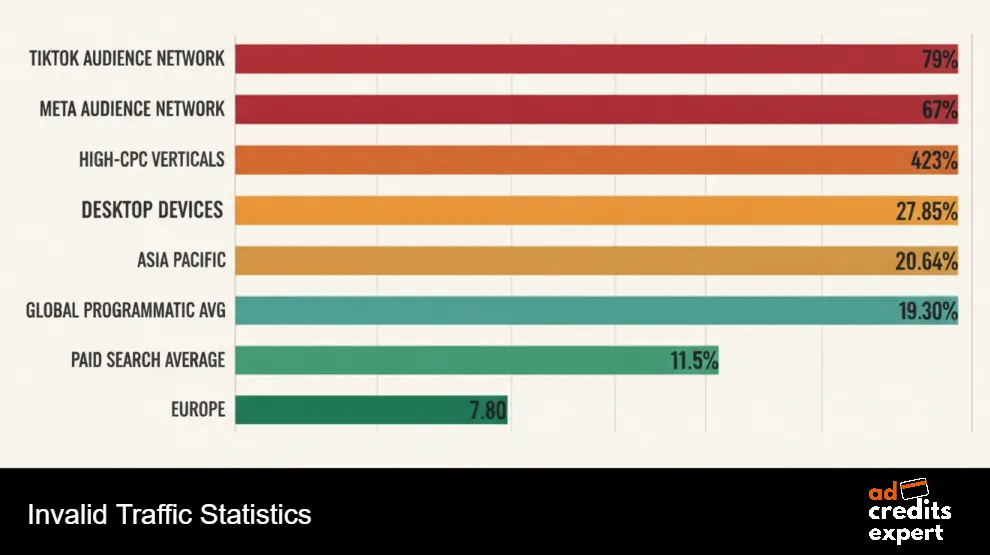
Search holds up better, with average invalid click rates near 11.5%. High-value verticals get hit far harder. Finance, legal, home services and real estate report rates as high as 42%.
Global fraud losses passed $100 billion annually and could reach $172 billion by 2028. Audience network placements remain the worst offenders by a distance.
| Environment | Invalid traffic rate | Risk level | What drives it | Our recommended action |
|---|---|---|---|---|
| Global programmatic average | 20.64% | High | Bot farms, domain spoofing, stacked ad units | Run third-party verification across all display buys |
| Paid search average | 11.5% | Moderate | Competitor clicks, click farms on costly terms | Exclude repeat IPs, monitor by hour and geography |
| High CPC verticals | Up to 42% | Severe | Organised click farms chasing expensive keywords | Fraud tooling pays for itself inside a month |
| TikTok Audience Network | 79% | Severe | Third-party app inventory with weak controls | Switch network placements off by default |
| Meta Audience Network | 67% | Severe | Off-platform placements bundled into delivery | Restrict placements manually, accept higher CPM |
| Desktop devices | 27.03% | High | Easier bot deployment, legacy software in use | Compare device performance weekly, not monthly |
| Mobile devices | 19.30% | Moderate | Emulators and mobile botnets | Watch session duration and bounce patterns |
| Europe against Asia Pacific | 7.80% against 27.85% | Varies sharply | Regulation and traffic sourcing differences | Geo-fence tightly when testing any new offer |
Programmatic Buying Became Almost Total
Roughly 97% of United States digital display spending now runs through automated buying systems. Programmatic display alone reaches $180 billion this year, up 13.3%.
Efficiency figures tell a harsher story. Industry association research found $26.8 billion of programmatic budget wasted, with under half of measured spend reaching a viewable, verified impression.
Our position stays consistent here. Programmatic works brilliantly for reach and terribly for accountability, unless you pair every buy with independent verification.
Ten Years Of Search Costs In One View
Zoom out and the direction becomes obvious. Every core search metric has roughly doubled or tripled since annual benchmarking began.
Read those four lines together and the picture is not gloomy at all. Clicks cost more, yet each one works far harder than it did ten years ago.
Mobile And Video Own Attention, So Budgets Followed
More than 70% of paid search impressions and clicks now happen on mobile screens. Mobile takes roughly three quarters of all digital ad spend globally.
Search spend on mobile heads toward 62% of category total by 2030. In-app advertising keeps climbing as attention shifts inside apps rather than browsers.
Video sits alongside that shift. Connected TV grows 11.5% this year while linear stays flat, and short video formats drive most social growth.
Who Actually Runs Paid Search In 2026
Adoption keeps widening, and small advertisers drive most of that growth. Nearly half of surveyed small businesses now run paid search, a share climbing every year.
Around 45% of small businesses invest in paid advertising of some kind. Typical global spend for that group sits near $3,500 monthly, with 45% going to search and 30% to social.
Enterprise behaviour looks nothing alike. Large advertisers regularly commit $50,000 or more each month, spread across search, social, retail media and connected TV.
Agencies sit awkwardly between both worlds. Each new client account resets credit eligibility, which is precisely why our agency members recover meaningful margin every month without changing their media mix.
What Advertisers Actually Spend Each Month
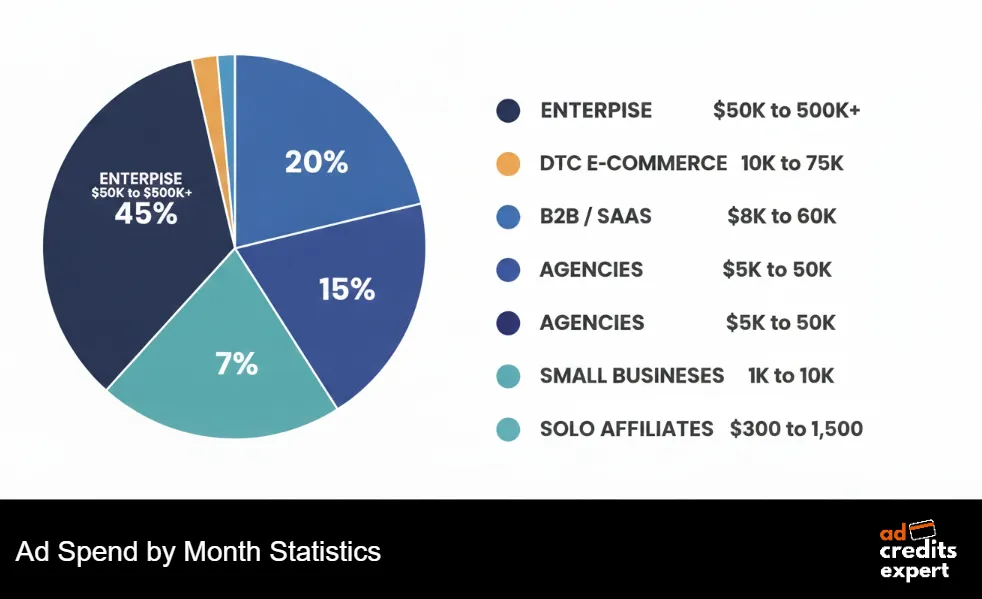
Benchmarks mean little without budget context. A $5.42 click reads very differently on $800 a month than on $80,000. Here sits our breakdown of spending by advertiser size.
| Advertiser type | Typical monthly PPC spend | Main channel split | Common blended ROAS | Where we see waste |
|---|---|---|---|---|
| Solo affiliates and side projects | $300 to $1,500 | Search and native heavy | 1.5x to 2.5x | Too many campaigns, too little data inside each one |
| Small businesses | $1,000 to $10,000 | 45% search, 30% social | 2x to 3x | No negative keyword hygiene, weak landing pages |
| DTC e-commerce brands | $10,000 to $75,000 | Meta and TikTok led | 3x to 4x blended | Creative refreshed monthly instead of weekly |
| Agencies per client account | $5,000 to $50,000 | Mixed across platforms | 2.5x to 4x | Unclaimed platform credits on brand new accounts |
| B2B and SaaS teams | $8,000 to $60,000 | Search, LinkedIn, Reddit | Measured on pipeline, not ROAS | Optimising to raw leads instead of qualified pipeline |
| Enterprise advertisers | $50,000 and above | Full channel mix plus retail media | Varies widely by category | Audience network placements left switched on |
Our Own Numbers From Seven Years Of Buying
Public benchmarks tell you what the market average did. They cannot tell you what a well-run account does. These figures come from our own tracking across roughly 50,000 buyers in our community.
The pattern behind those figures stays simple. Effective acquisition cost drops fastest when credits get applied during testing, never during scaling. Free budget belongs where the risk sits.
How we read the market: the gap between average and good widened again this year. Automation rewards accounts with clean conversion data and punishes accounts without it. Industry averages hide that split completely.
Where We Expect PPC Costs To Land By 2027
Now our own forward calls. These are not borrowed forecasts. They come from our tracking, our client work, and our reading of how platforms behave when inventory tightens.
One prediction we hold loosely. If AI answer surfaces start carrying transactional queries at volume, click prices on classic search could soften for a first time in a decade.
We also expect creative production speed to become a bigger cost lever than bidding strategy. Feeds now reward advertisers refreshing assets weekly, and punish everyone else with quiet delivery decay.
Budget diversification should accelerate too. Buyers concentrated entirely on one platform carried the most volatile results across our member base this year, by a wide margin.
How To Use These Benchmarks Without Wrecking Your Account
Benchmarks work as diagnostic tools, never as targets. We have watched plenty of accounts get worse while chasing an industry average that never applied to them.
Frequently Asked Questions About PPC
What is the average cost per click in 2026?
Blended average across search advertising is $5.42. Legal services sits highest at $9.87, while arts and entertainment costs just $1.63 per click.
What counts as a good conversion rate for paid search?
Cross-industry average sits at 8.18%. Anything above your own vertical benchmark counts as strong. Pet, automotive repair and education accounts regularly clear 13%.
Does PPC still deliver positive returns?
Yes. Average return sits near $2 earned per $1 spent, roughly 200%. Well-optimised accounts with strong landing pages push considerably higher than that.
Which platform gives the cheapest clicks?
TikTok and Amazon offer the lowest click prices among major platforms. Microsoft Ads delivers the best cost per qualified lead in search, at roughly a third less than Google.
How much are AI Overviews hurting paid search?
Paid click through rate on affected queries fell from 19.70% to 6.34%. Commercial and transactional keywords trigger Overviews far less often than informational ones.
How much ad budget disappears into invalid traffic?
Around 20.64% of programmatic impressions and 11.5% of search clicks show fraud signals. Expensive verticals report rates reaching 42%.
How much should a small business spend monthly?
Most small advertisers run between $1,000 and $10,000 a month. Roughly 45% goes to search, 30% to social, and the remainder across other channels.
Where do these PPC Statistics come from?
Every figure comes from primary industry reporting published across 2026, cross-checked against our own account tracking before publication. Full source list sits below.
Final Read On The 2026 Numbers
Paid media in 2026 rewards discipline over volume. Clicks cost more, answer engines absorb easy queries, and roughly a fifth of programmatic inventory never reaches a human being.
Yet conversion rates improved almost everywhere, and lead costs finally fell. Advertisers who fixed tracking, fed automation properly and diversified beyond one platform came out ahead this year.
That is the story these PPC Statistics tell once you read them together rather than in isolation. Use our tables as a mirror, then go stretch your budget further with credits before competitors beat you to them.
Sources
- WordStream by LocaliQ, 2026 Google Ads Benchmarks
- LocaliQ, 2026 Search Advertising Benchmarks
- Statista, Search Advertising Worldwide Outlook
- WARC, Global Advertising Forecast
- EMARKETER, Retail Media Network Forecasts
- EMARKETER, Amazon Advertising Revenue Outlook
- Fraudlogix, 2026 Invalid Traffic Report
- TrafficGuard, Click Fraud Statistics
- Adthena, AI Overviews And Paid Search Research
- Seer Interactive, AI Overviews Impact Study
- dentsu, Global Ad Spend Forecasts
- Triple Whale, Meta Advertising Benchmarks
- IAB and PwC, Internet Advertising Revenue Report
- Coupler.io, PPC Benchmarks Collection
- Search Engine Journal, Google Ads Benchmark Analysis
- StatCounter, Search Engine Market Share
- AdCredits Expert, member claim and cashback tracking

About the author

Jordan Blake
A digital advertising specialist with years of experience in optimizing ad spend and leveraging promotional credits across platforms like Google Ads, Meta Ads, and more.
Similar Posts



Spend $200 → Get $200
Spend $500 → Get $500
Spend $1,000 → Get $1,000
Spend $4,000 → Get $4,000
Spend $6,000 → Get $6,000
Leave a Reply