Facebook Ads Statistics 2026: Meta Revenue Near $243B This Year
Author: Jordan Blake
Meta’s ad machine is on track for roughly $243 billion in 2026, and Facebook still sits at the centre of it. The average cost per click now runs about $1.72, up from $1.55 a year ago.
Median return sits near 1.9x for shops, while AI-run campaigns push past 4x. Ad costs are climbing, but smart buyers are still winning.
We run paid media for a living at AdCredits Expert, so these Facebook Ads Statistics come from real accounts, not guesswork. Grab a coffee. Let us walk you through every number that moves your budget.
The Money Machine: Facebook Advertising Revenue Right Now
Start with the headline number. Meta closed 2025 with $200.97 billion in total revenue. That was a 22% jump on the year before.
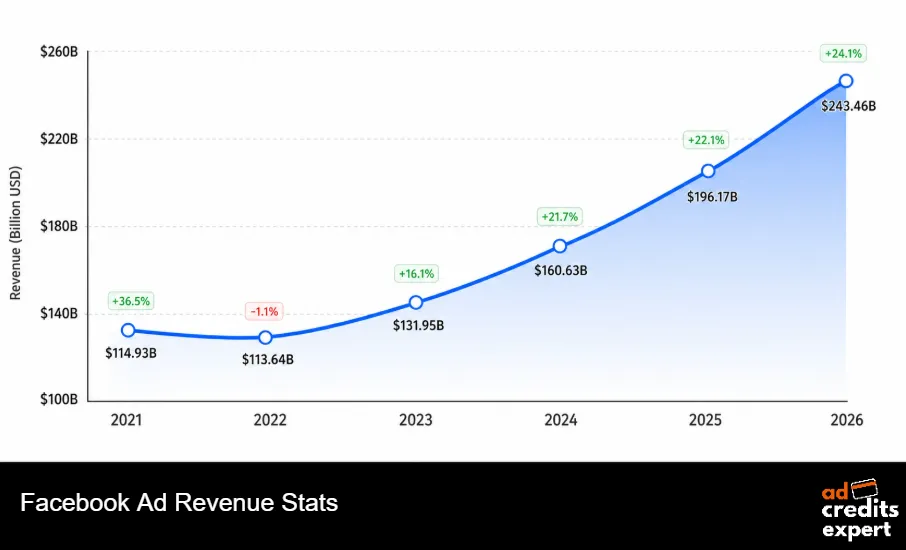
Almost all of that came from ads. Meta advertising revenue worldwide hit around $196 billion in 2025. Ads make up close to 98% of the whole business.
For 2026, forecasts put Meta’s net ad revenue near $243 billion. If that holds, Meta passes Google as the biggest digital ad seller on the planet.
Facebook is the workhorse inside that number. Reality Labs pulled in just $2.21 billion in 2025, with losses north of $75 billion since 2020. So when people say Meta is an ad company, the maths agrees.
Here is how the family ad revenue has stacked up year on year.
| Year | Meta Family Ad Revenue | Year-On-Year Growth |
|---|---|---|
| 2021 | $114.93 billion | +36.5% |
| 2022 | $113.64 billion | -1.1% |
| 2023 | $131.95 billion | +16.1% |
| 2024 | $160.63 billion | +21.7% |
| 2025 | $196.17 billion | +22.1% |
| 2026 (our read) | $243.46 billion | +24.1% |
One number stands out to us. Revenue dipped in 2022, then never looked back. Every year since has posted double-digit growth.
Our call for 2026: growth stays above 20%. AI ad tools and video inventory are doing the heavy lifting. We expect Facebook alone to hold well over half of the family ad haul.
Straight from our media buyers: ad prices rose across almost every account we touched last year. The advertisers who kept profits did one thing well. They fed the algorithm cleaner data and better creative, then let it run.
How Many People Facebook Ads Can Actually Reach
Scale is the reason nobody quits this platform. Facebook counts about 3.07 billion monthly active users. Roughly 2.11 billion of them log in every single day.
Across the whole Meta family, daily active people sat at 3.56 billion in early 2026. That was a small dip from 3.58 billion late in 2025, the first sequential drop Meta has ever reported.
Ad reach is the figure that matters for buyers. Facebook ads can land in front of roughly 2.4 billion people. That is close to a third of everyone on earth aged 13 and over.
Who You Are Actually Buying In Front Of
Reach means little without knowing the faces behind it. Facebook skews slightly male and slightly older than the hype suggests.
The biggest slice is prime spending age. That is why the platform still prints money for direct-response brands.
| Audience Segment | Share Of Facebook Users | What It Means For Buyers |
|---|---|---|
| Age 25 to 34 | Around 24.97% | Largest group, strong buying power |
| Age 35 to 44 | Around 18.68% | High income, family purchases |
| Age 18 to 24 | Around 17% | Cheaper reach, lower intent |
| Male users | Around 55% | Slight male tilt overall |
| Female users | Around 45% | Higher engagement on many verticals |
| India (top market) | 500 million-plus users | Low CPMs, huge test volume |
| United States | Around 253 million users | Highest revenue per user |
Here is a stat we lean on constantly. North American users bring Meta about $68 in yearly revenue per person. The global average is a fraction of that.
So a US click costs more, but it usually earns more too. We tell clients to judge cost against value, never against a global average.
What Facebook Ads Cost In 2026: CPC, CPM And CTR
Now the part everyone scrolls for. Costs went up in 2026, plain and simple. But the picture is friendlier than the panic suggests.
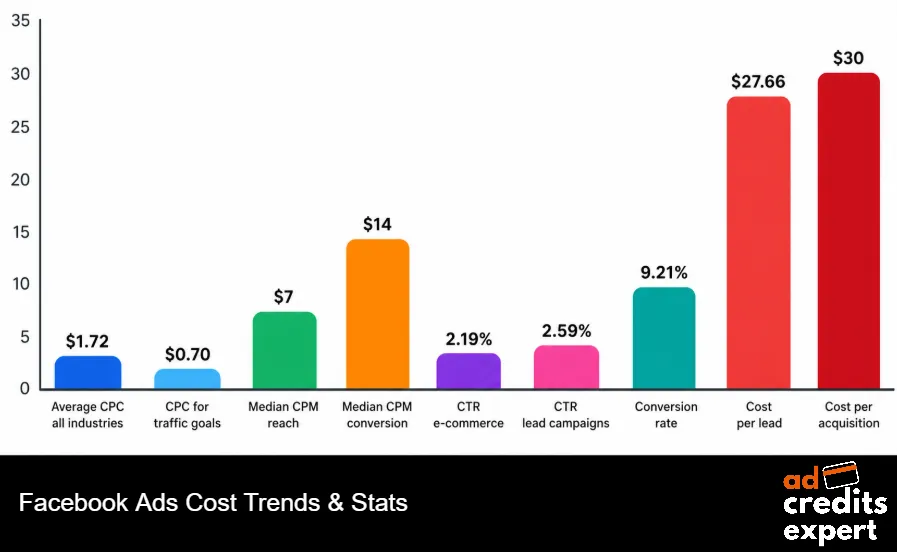
The all-industry average cost per click is about $1.72. A year earlier it sat near $1.55. That is an 11% rise.
Traffic campaigns run cheaper. Median CPC for pure traffic goals lands around $0.70. Lead and sales goals cost more because you are buying intent.
These are the core benchmarks we brief every new client on.
| Metric | 2026 Benchmark | Healthy Target |
|---|---|---|
| Average CPC (all industries) | $1.72 | Below your vertical median |
| CPC for traffic goals | $0.70 (median) | $0.35 to $0.90 |
| Median CPM | $13.48 to $14.19 | Under $12 on reach goals |
| Median CTR (e-commerce) | 2.19% | Above 1.5% |
| CTR for lead campaigns | 2.59% | Above 2% |
| Average conversion rate | 9.21% (platform) | Beat your industry mean |
| Average cost per lead | $27.66 | Depends on lead value |
| Average cost per acquisition | Around $30 | Under 30% of order value |
A quick reality check on CPM. Reach campaigns are the cheapest way to show up, near $7 for a thousand views. Conversion campaigns pay double, near $14 to $15, because Meta targets warmer users.
That gap is not waste. You pay more to reach people who actually buy. We happily accept a higher CPM when the sale rate justifies it.
What we are seeing: CPCs peak every November as retail floods the auction. Prices then reset lower in January. Lock your holiday promos early and budget for the spike, do not get caught off guard.
Cost Per Click By Industry: The Real Spread
A single average hides the truth. Your industry decides your costs far more than any tweak you make.
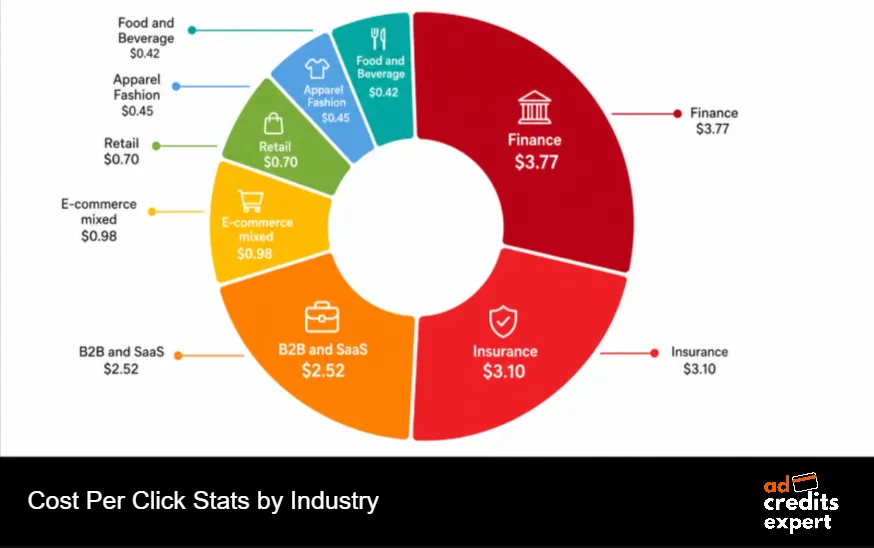
Cheap verticals and pricey ones sit worlds apart. The gap between the lowest and highest CPC is roughly nine times.
| Industry | Average CPC (2026) | Typical CPM | Buyer Note |
|---|---|---|---|
| Food and Beverage | $0.42 | Low | Cheap clicks, low order value |
| Apparel and Fashion | $0.45 | Low to mid | Volume play, creative wins |
| Retail | $0.70 | Mid | Steady, seasonal spikes |
| E-commerce (mixed) | $0.98 | Mid | Advantage+ territory |
| B2B and SaaS | $2.52 | $14.87 | High value per lead |
| Insurance | $3.10 | High | Fierce auction, strong LTV |
| Finance | $3.77 | $17.90 | Priciest clicks, best margins |
Read this the right way. A $3.77 finance click can still be a bargain if a customer is worth thousands.
A $0.42 food click can lose money if the basket is tiny. Never judge a click without its conversion value beside it.
Conversion Rates Are Where Money Is Made Or Lost
Here is a truth most guides skip. Conversion rate is your biggest lever, bigger than CPC or CTR.
Rates swing hard by sector. Real estate lead forms convert near 2.15%. Education pushes past 13%, and fitness offers touch 14%.
Our take is blunt. If your click rate is strong but sales are weak, the ad is fine. The problem sits on your landing page or your offer.
Return On Ad Spend: What Advertisers Really Get Back
Everyone asks the same question. Do Facebook ads still pay? The short answer is yes, for buyers who run them properly.
Median return on ad spend for online shops sits near 1.86x to 1.93x. That means roughly $1.90 back for every $1 in.
Averages across sectors land higher, near 2.8x to 3.6x. Full-funnel AI campaigns report the strongest numbers, near 4.2x.
| Industry | Typical ROAS (2026) | Read |
|---|---|---|
| Baby Products | 4.39x or more | Repeat buyers, loyal base |
| Automotive | Around 2.54x | Strong intent traffic |
| E-commerce (median) | 2.79x | Solid, creative-led |
| Beauty and Personal Care | 1.57x | Crowded, high CPMs |
| Media and Publishing | 1.17x | Thin margins, volume game |
| Full-funnel Advantage+ | 4.2x average | AI-run, big-budget accounts |
One honest warning. Meta’s reported ROAS often flatters reality. Platform numbers can overstate true results by 20% to 50% versus proper incrementality tests.
Meta also dropped its 7-day and 28-day view-through windows in January 2026. So your dashboard may read lower now. That is a measurement change, not a performance crash.
Our read on ROAS: trust holdout tests over the in-platform figure. We expect the honest, like-for-like AI lift to sit near 12% to 22% for most accounts, wider for big spenders and thin for tiny budgets.
Advantage+ And AI Bidding Took Over
This is the biggest shift in the whole report. Automation stopped being optional in 2026.
Roughly 82% of advertisers now run some form of Advantage+. AI bidding is no longer a test, it is the default setup.
The performance gap is real and measured. Here is what AI-led campaigns deliver against manual ones.
There is a catch worth flagging. Advantage+ Shopping’s share of US retail spend actually slid from 38% to 20% across recent quarters. Some buyers pulled back to take manual control after the first automation rush.
Our stance sits in the middle. Feed the AI six to ten creative assets, give it budget to learn, then judge results after two weeks. Do not micromanage it on day one.
The data all points one way. Creative quality now drives 50% to 70% of performance. The algorithm handles targeting, so your assets are the real battleground.
Video And Reels Ads Ate The Feed
If you still run static-only, the data is waving a red flag. Video won.
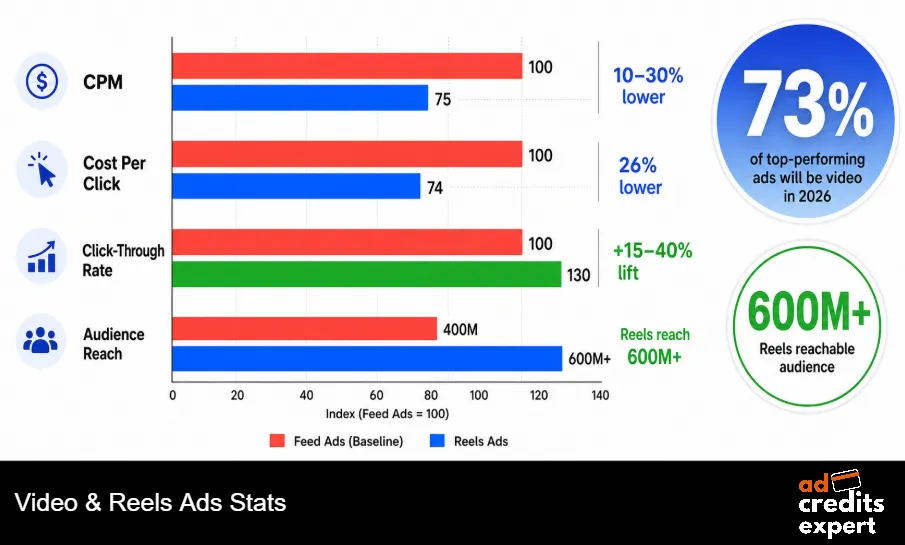
About 73% of top-performing ads in early 2026 were video. Short-form is where attention lives now.
Facebook Reels ad placements are the growth engine. Reels inventory surged, and the format now reaches hundreds of millions of extra viewers.
We keep it simple for clients. Shoot vertical, native-style video first. Ads that feel like organic Reels beat polished commercials on both cost and click rate.
The first three seconds decide everything. Lead with a hook, a question, or an odd visual. Never open with a logo, you will lose the swipe.
AdCredits Expert take: native video is the single cheapest lever left on Meta. Creative that looks unscripted can lift click rate 15% to 40% over ads that scream advertisement. We expect this gap to widen through 2026.
Mobile Ads Run The Whole Show
This one is almost boring now, but it still catches people out. Facebook is a phone platform.
The vast majority of ad impressions land on mobile screens. Desktop-only users are a rounding error.
The lesson writes itself. Design for a thumb, not a mouse. If your landing page loads slowly on a phone, your ad budget is leaking before the click even counts.
Around 20% of users bounce before the page loads. That is money gone with nothing to show. Fix page speed first, then scale spend.
Ad Engagement Rates: The Numbers Behind The Scroll
Engagement on Facebook looks tiny on paper. Do not let the small decimals fool you.
Average engagement across all post types sits near 0.05%. Format changes that number more than most people expect.
Here is how the main formats stack up on engagement:
Page size changes the story even more than format does. Reach behaves in reverse of what you might guess.
- Pages under 10,000 fans earn about 0.32% engagement, the highest band by far.
- Pages with 10,000 to 100,000 fans settle near 0.16%, a solid middle ground.
- Pages above 100,000 fans drop to roughly 0.03%, as sheer scale dilutes reach.
One finding surprises new buyers every time. Smaller pages get stronger engagement per follower.
A page under 10,000 fans earns reactions at more than ten times the rate of a giant brand page. So a modest audience is not a weakness. Treat it as an advantage.
By sector, education leads engagement near 2.2%, with healthcare close behind near 1.9%. Both run content people genuinely want to save and share.
What our data confirms: ads that mimic native posts beat branded polish on engagement almost every time. We build creative to blend into the feed, not to stand out as an obvious advert.
How Many Ad Impressions Facebook Serves
Volume is the quiet story here. Facebook is an impression firehose.
The platform serves roughly 195 billion ad impressions each month worldwide. US advertisers soak up about 24% of that total.
Frequency matters as much as reach. Show the same ad too often and fatigue sets in fast. We watch frequency like a hawk to avoid burning creative.
Here is a number worth pinning up. About 95% of ad conversions involve at least one view before the click. So impressions do real work, even when nobody clicks straight away.
The Advertiser Base: Who Is Actually Buying Ads
Facebook is not a niche tool for big brands. It is a mass market for advertisers.
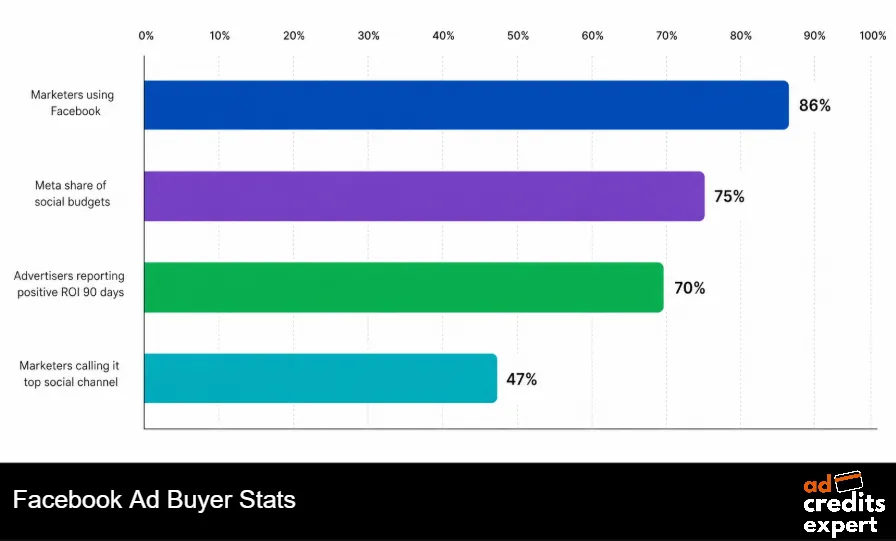
Somewhere between 8 million and 10 million active advertisers run ads across Meta apps. Most of them are small and medium businesses, not enterprises.
| Advertiser Data Point | 2026 Figure | Why It Matters |
|---|---|---|
| Active advertisers on Meta apps | 8 to 10 million | Fierce auction, rising CPMs |
| Marketers using Facebook | Around 86% | Still the default channel |
| Marketers calling it their top social channel | Around 47% | Beats every rival platform |
| Typical small business monthly spend | $1,000 to $3,000 | Budget shapes AI results |
| Advertisers reporting positive ROI in 90 days | Around 70% | Most see returns fast |
| Share of social ad budgets on Facebook and Instagram | 75%-plus | Meta owns paid social |
Note that spend threshold. AI bidding needs conversion volume to learn. Accounts under about $2,000 a month see a thinner automation edge.
So if you run a lean budget, our advice shifts. Consolidate campaigns, keep audiences broad, and give the algorithm enough signals to work with.
Retargeting Still Beats Cold Traffic By A Mile
One old rule holds firm in 2026. Warm audiences convert far better than cold ones.
We push every client toward server-side tracking now. Browser signals keep weakening, so clean first-party data is your edge in the auction.
Facebook Is A Shopping Engine Now, Not Just A Feed
User behaviour shifted, and it changed how ads work. People now shop on Facebook, they do not just scroll.
Nearly 40% of social users open Facebook to find new products. The feed acts more like a search bar for buying intent.
- One in four young daily users in the US and Canada uses Facebook Marketplace.
- Clothing and apparel brands show the heaviest Meta concentration of any vertical.
- Around 31% of shop owners earning over $1 million call paid ads their top growth channel.
We treat this as a big opening. Buyers who answer real questions in their ad copy win that shopping moment. Sell the solution, not the brand slogan.
Titles matter more than most admit. Facebook ads with four-word headlines tend to perform best. Short and clear beats clever and long.
Instagram vs Facebook Placements: Where Clicks Run Cheaper
Placement choice quietly shapes your whole cost structure. The two apps price very differently.
Facebook and Instagram carry similar CPMs. But Instagram charges a higher CPC, because users engage visually and click less.
Here is how each placement prices out for buyers right now:
Our default mix looks like this. Split budget across Feed, Reels and Stories rather than dumping it all in one spot.
Move 20% to 30% of spend into Reels, where CPMs run lower. That single shift often lifts blended results without touching your offer.
Ad Fatigue And Creative Refresh: The Silent Budget Killer
Every winning ad has a shelf life. Ignore it and your costs creep up quietly.
Creative fatigue usually sets in within 7 to 14 days on active campaigns. Click rates fade, then CPMs rise as Meta senses weaker signals.
Our routine is simple and strict. Refresh top creatives before they tank, not after. Keep a bank of new hooks ready so you never run dry mid-scale.
From our testing desk: the accounts that refresh weekly hold steady costs far longer than the ones that set and forget. Fatigue is not bad luck. It is a schedule you failed to plan.
Threads Ads: The Cheap New Inventory Nobody Booked Yet
Here is a fresh angle for 2026. Threads opened ads to all advertisers in January 2026.
The app crossed 400 million monthly users by early 2026. Early ad prices are low because supply beats demand.
We treat this like a land grab. Cheap reach rarely lasts once buyers pile in. Test Threads now while the CPMs are soft, then decide with your own data.
Where we think spend is heading: the smart money is testing Reels and Threads for cheap impressions, then retargeting on Feed where intent is highest. Cheap reach up top, warm conversions down low.
Our 2026 Predictions For Facebook Ads
We have run paid media for over seven years. Based on what we see across accounts, here is our honest call for the rest of 2026.
The pattern never really changes. Ad platforms get pricier every year. The buyers who win treat this like a business, not a lottery.
One more thing from our desk: free ad credits stretch every one of these numbers further. A lower effective CPM means a higher effective ROAS. That is exactly why we hunt credits for a living.
Facebook Ads Statistics 2026: The Quick Recap
Let us tie it together before the questions. These are the figures worth pinning above your desk.
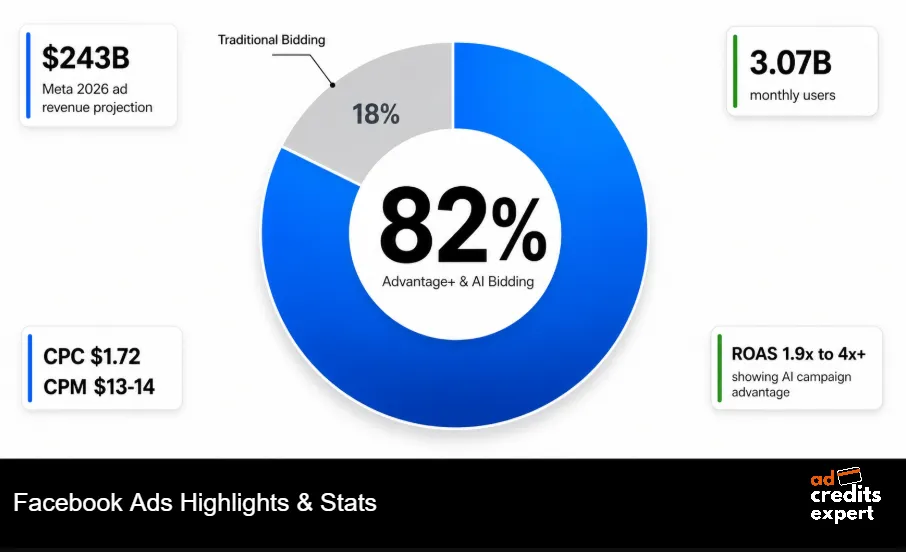
Keep these Facebook Ads Statistics handy. They set the benchmark you measure every campaign against.
Frequently Asked Questions
What is the average cost per click on Facebook Ads in 2026?
The all-industry average CPC is about $1.72 in 2026. That is up around 11% from $1.55 in 2025. Traffic goals run cheaper, near $0.70 median. Finance and insurance sit highest, above $3.50.
Is a good ROAS still achievable on Facebook in 2026?
Yes. Median online-shop ROAS lands near 1.9x. Across sectors the average sits near 2.8x to 3.6x. Full-funnel AI campaigns report about 4.2x. Trust holdout tests over the in-platform figure, since dashboards can overstate results.
How many people can Facebook Ads reach in 2026?
Facebook ads reach roughly 2.4 billion people. The platform counts about 3.07 billion monthly active users and 2.11 billion daily. That is close to a third of the global population aged 13 and over.
What is a good CTR for Facebook Ads in 2026?
Aim above 1.5% for most verticals. The median e-commerce CTR is about 2.19%. Lead campaigns average near 2.59%. Strong video and native Reels creative push these numbers higher.
Should I use Advantage+ or manual campaigns?
Automation now wins for most accounts. AI bidding delivers about 27% higher ROAS than manual on comparable campaigns. Advantage+ Shopping cuts cost per acquisition near 32%. Feed it strong creative and enough budget to learn.
Are Facebook Ads worth it for a small business?
For most, yes. Around 70% of advertisers report positive ROI within 90 days. Small businesses typically spend $1,000 to $3,000 a month. Budgets under $2,000 see a smaller AI edge, so keep campaigns simple and audiences broad.
Why did my Facebook ROAS drop in 2026 even though sales held?
Meta removed its 7-day and 28-day view-through windows in January 2026. So the platform now credits fewer conversions to your ads. Your real sales may be steady. Check holdout tests to see true performance.
Sources
We cross-checked every figure against primary reports and trusted data providers before publishing. Full references below.
- Statista, Meta advertising revenue worldwide
- eMarketer, digital ad spending forecasts
- Oberlo, Facebook ad revenue by year
- DataReportal, Digital 2026 global overview
- Shopify, Facebook statistics for business
- DemandSage, Facebook user statistics
- WordStream, Facebook Ads benchmarks by industry
- Pew Research Center, social media use
- Meta Investor Relations, quarterly and annual earnings
- Gartner, marketing and advertising research

About the author

Jordan Blake
A digital advertising specialist with years of experience in optimizing ad spend and leveraging promotional credits across platforms like Google Ads, Meta Ads, and more.
Similar Posts

Spend $200 → Get $200
Spend $500 → Get $500
Spend $1,000 → Get $1,000
Spend $4,000 → Get $4,000
Spend $6,000 → Get $6,000
Leave a Reply