Facebook Ads Statistics for 2025: Top Insights for Smart Marketers
Facebook Ads Statistics for 2025: Top Insights for Smart Marketers
Author: Jordan Blake
Updated on: May 28, 2025
Facebook advertising isn’t slowing down anytime soon, and smart marketers know that staying on top of the latest Facebook Ads Statistics gives them a proper advantage over the competition.
With Meta pulling in massive ad revenue and conversion rates hitting 9.21%, there’s serious money to be made if you know what you’re doing right.
These fresh performance benchmarks and cost metrics will help you optimise your ad spend, boost your ROI, and make your marketing campaigns actually profitable in today’s competitive digital market. Let’s see what’s really working in 2025.
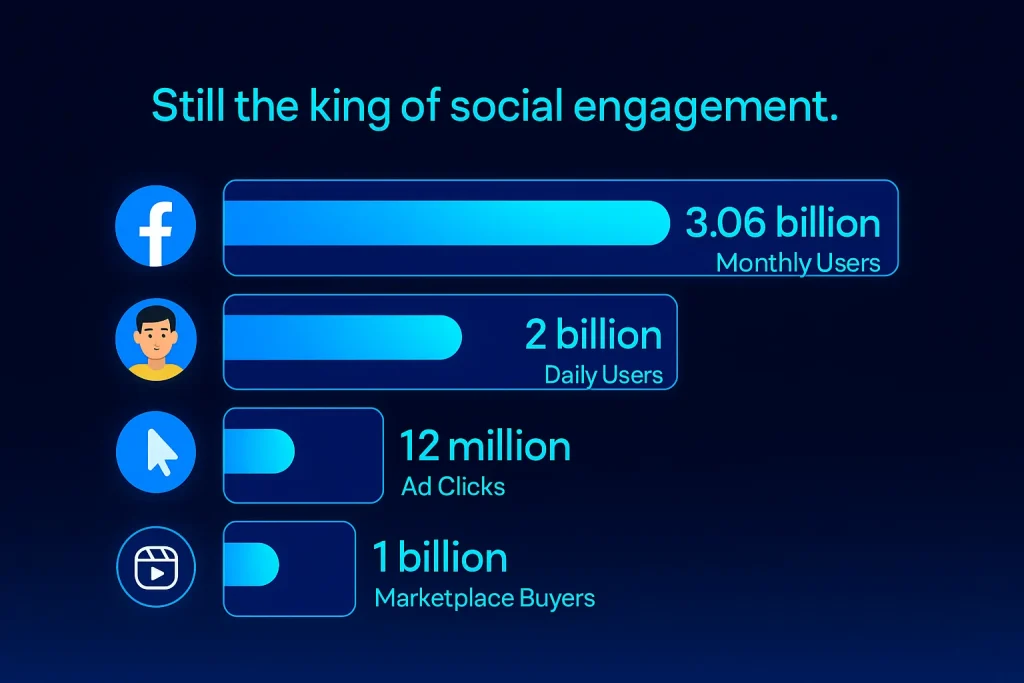
ⓕ Facebook’s Reach and User Demographics
Monthly Active Users: Facebook boasts over 3.06 billion monthly active users as of 2025, making it the largest social media platform globally.
Daily Usage: 2 billion people use Facebook every day, reflecting its deep integration into daily life.
Audience Breakdown: While the platform’s audience is aging, millennials and young adults (18–29) remain highly active, especially in Marketplace, Groups, and Reels. However, teen usage continues to decline.
Global Penetration: Facebook ads reach 62.2% of the U.S. population aged 13 and above, and the average user clicks on 12 ads per month.
💰📊 Facebook Ad Revenue and Market Share
Ad Revenue: Facebook’s worldwide ad revenue is projected to hit $116.53 billion in 2025, making Meta the second-largest digital ad company globally, just behind Alphabet (Google).
Growth: In 2024, Facebook’s ad revenue reached $164.5 billion, up from $134 billion in 2023, highlighting continued growth despite rising competition.
Advertiser Base: There are 10 million active advertisers on Facebook, with 91% of businesses using the platform for marketing and engagement.
📈 Facebook Ads Performance Benchmarks
Metric
2024 Average
2025 Benchmark
Notes
Click-Through Rate (CTR)
1.51%–2.53%
1.8%–2.53%
Higher for lead-gen and niche markets
Conversion Rate (CVR)
8.2%
9.0%–9.21%
Improved targeting and AI boost conversions
Cost Per Click (CPC)
$0.77–$1.88
$0.77–$1.88
Lower for traffic ads, higher for lead-gen and specific industries
Cost Per Action (CPA)
–
$18.68
Varies widely by industry
Cost Per Lead (CPL)
–
Stable/Decreasing
Smarter targeting reduces CPL
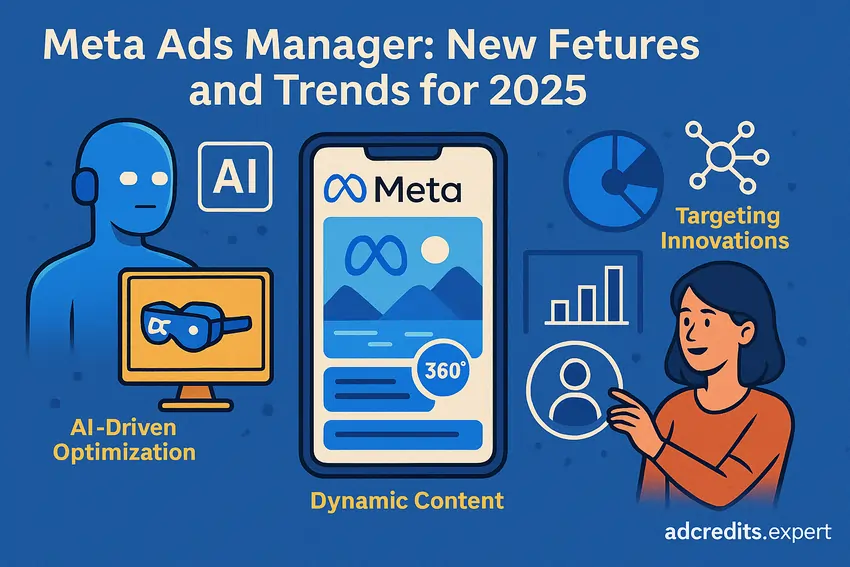
🌐 Meta Ads Manager: New Features and Trends for 2025
AI-Driven Optimization: Meta Ads Manager now uses advanced AI for dynamic content placement, AR ads, and immersive 360-degree videos. Advertisers can upload multiple creative assets, and Meta’s AI will optimize delivery for each user.
Dynamic Content: Ads can feature several captions, images, and videos, automatically tailored for optimal engagement.
Targeting Innovations: AI-driven audience targeting and Meta Advantage+ audiences allow for more precise and automated reach, reducing manual setup and improving results.
Key Facebook Ads Metrics to Track
To maximize your campaign’s effectiveness, monitor these essential metrics:
Click-Through Rate (CTR): Measures ad relevance and appeal.
Cost Per Click (CPC): Indicates cost-efficiency.
Conversion Rate (CVR): Reflects how well ads drive desired actions.
Return on Ad Spend (ROAS): Shows revenue generated per dollar spent.
Frequency: Tracks ad repetition and potential fatigue.
Video View Percentage: Gauges engagement with video ads.
Quality Ranking & Relevance Score: Compares ad quality to competitors.
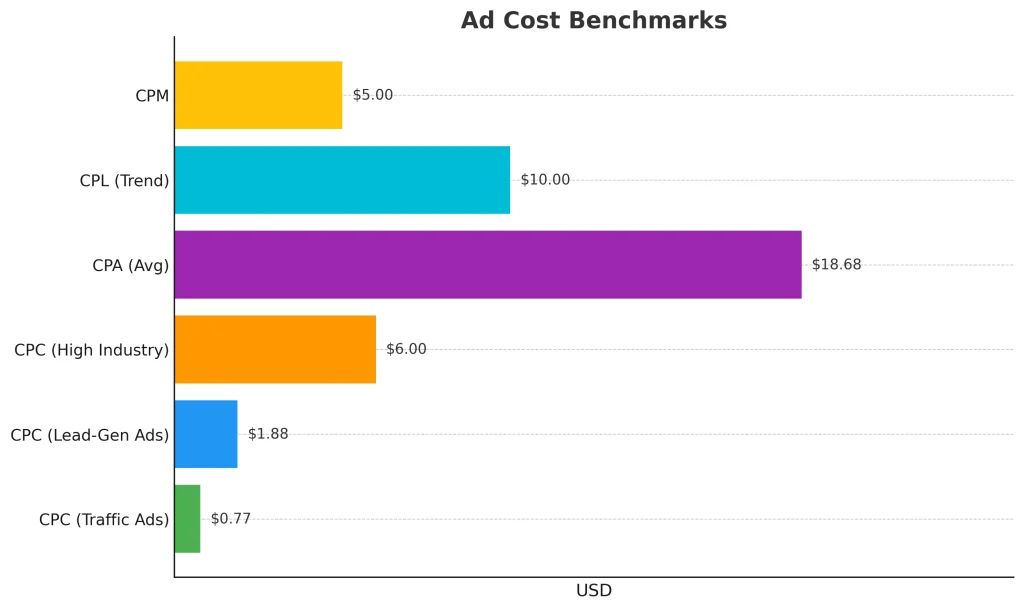
💸 Cost Benchmarks: CPC, CPM, CPA, and CPL
Average CPC: $0.77 for traffic ads, $1.88 for lead-gen ads. Certain industries (e.g., attorneys, dentists) see higher CPCs ($4–$8+).
Cost Per Action (CPA): $18.68 on average, but varies widely by industry.
Cost Per Lead (CPL): Expected to stabilize or decrease due to smarter targeting and AI-driven personalization.
CPM (Cost Per Mille): Not explicitly stated, but remains competitive compared to other platforms.
💰 Conversion Rates and ROI
Average Conversion Rate: 8.78%–9.21% across all industries, with higher rates in dental, real estate, and industrial sectors.
ROI: 40% of marketers cite Facebook as one of their top three ROI drivers in social media marketing.
Best ROI Sectors: E-commerce, real estate, and local services see particularly strong returns.
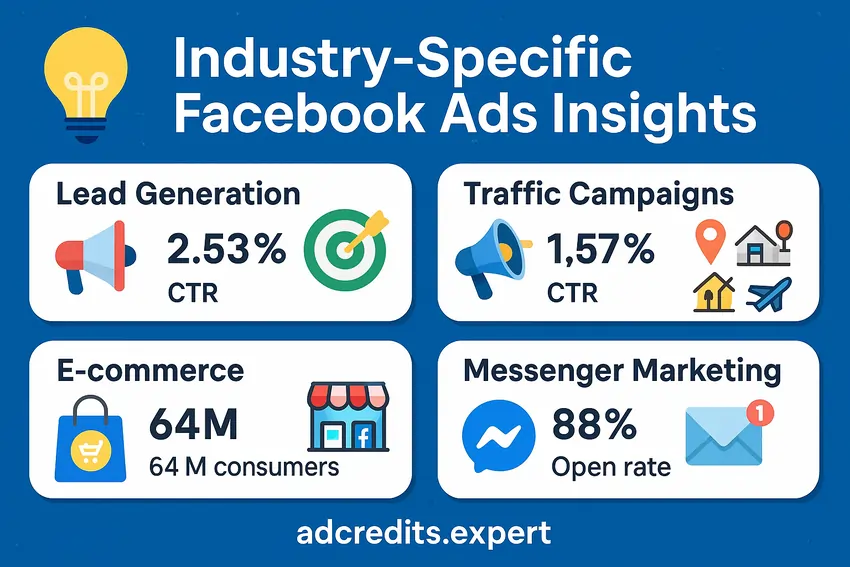
💡 Industry-Specific Facebook Ads Insights
Lead Generation: CTR for lead-gen ads is 2.53%, with conversion rates above 9%.
Traffic Campaigns: Lower CTR (1.57%), but still effective in high-engagement sectors like real estate, restaurants, and travel.
E-commerce: 64 million consumers shop on Facebook, and Marketplace sees 1 billion buyers monthly.
Messenger Marketing: Messages sent via Facebook Messenger achieve 88% open rates and up to 56% CTR.
✨ Video and Creative Trends in Facebook Advertising
Video Dominance: 40% of Facebook user time is spent watching videos, and 3.5 billion Reels are shared daily.
Vertical Video Ads: Convert 3% higher per dollar spent when featuring speech or voiceover.
Creative Diversification: Brands are encouraged to use a mix of formats-Reels, Stories, AR, and 360-degree videos-to maximize engagement.
🎯 Best Practices for Facebook Ads in 2025
Use AI and Automation: Use Meta’s AI-driven tools for smarter targeting, dynamic creative, and campaign optimization.
Diversify Ad Formats: Mix video, carousel, and immersive formats to capture attention and drive engagement.
Optimize for Mobile and Video: Prioritize vertical videos and mobile-first creative, as most users access Facebook via mobile devices.
Test and Iterate: Run A/B tests on creatives, audiences, and keywords to continually improve performance.
Monitor and Refine Metrics: Track key metrics like CTR, CPC, CVR, and ROAS to ensure campaigns are cost-effective and delivering results.
Frequently Asked Questions
Are Facebook Ads still effective in 2025?
Yes. With over 3 billion users, advanced targeting, and new ad formats, Facebook Ads remain one of the most effective digital advertising tools for brand awareness, lead generation, and sales.
What is the average conversion rate for Facebook Ads in 2025?
The average conversion rate is 8.78%–9.21%, with some industries exceeding this benchmark due to improved AI targeting and creative personalization.
How much does it cost to advertise on Facebook in 2025?
Average CPC ranges from $0.77 to $1.88, with higher costs in competitive industries. CPA averages $18.68, but costs vary by campaign objective and sector.
What’s new in Meta Ads Manager for 2025?
Meta Ads Manager now features dynamic content placement, AI-driven targeting, AR and 360-degree ad formats, and improved automation for campaign management.
Conclusion
There you have it – the most up-to-date Facebook Ads Statistics that actually matter for your marketing campaigns in 2025. These performance metrics aren’t just numbers to impress your mates; they’re your roadmap to better ROI and smarter ad spend.
With conversion rates sitting pretty at 9.21% and billions still scrolling daily, Facebook advertising remains a goldmine for savvy marketers.
Use these benchmarks to fine-tune your campaigns, test what works, and leave your competitors wondering how you’re crushing it. The data’s in your hands – now go make some serious money with it.
Sharing is caring:-
About the author
Jordan Blake
A digital advertising specialist with years of experience in optimizing ad spend and leveraging promotional credits across platforms like Google Ads, Meta Ads, and more.


Leave a Reply