Google Ads Statistics 2026: Trends, Figures, & Insights for Advertisers
Author: Jordan Blake

Here is the short version before you scroll. Google Ads pulled in $294.69 billion for Google in 2025. One ad platform out-earned the GDP of most countries.
The average cost per click now sits near $5.42, up again this year. Mobile drives roughly 64% of every click you buy.
Performance Max runs inside most active accounts. AI bidding steers around 70% of the money.
We run paid media daily at AdCredits Expert, so these Google Ads statistics come from real campaigns and real spend, not recycled fluff.
Below we break down what the 2026 figures mean for your budget.
Google Ad Revenue: The Machine Behind Every Auction
Start with the money, because everything else follows it. Google made $294.69 billion in advertising during 2025. Alphabet as a whole crossed $402.8 billion in total revenue, a 15% rise on the year.
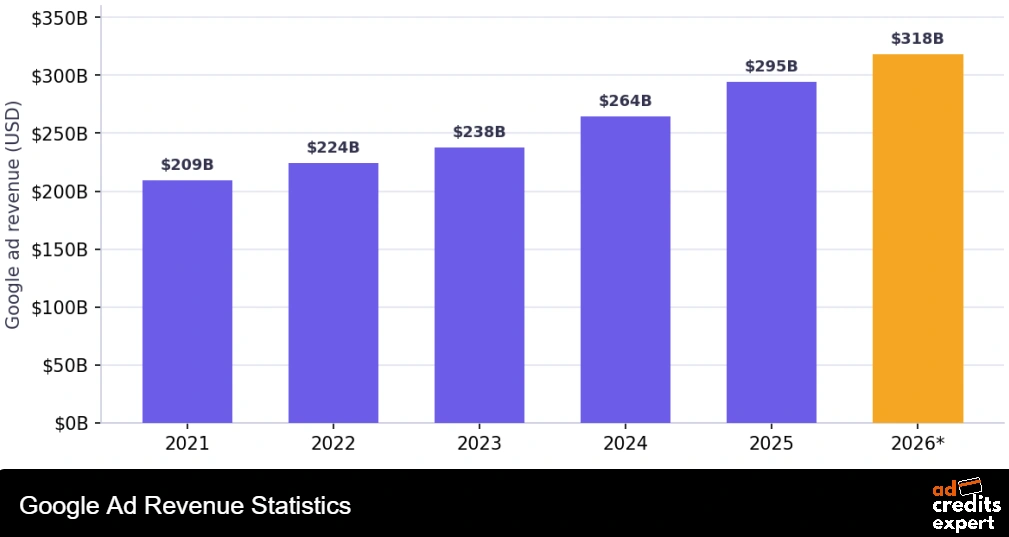
Advertising still funds most of the company. Roughly three-quarters of Alphabet’s revenue comes from ads. Search is the biggest slice of that pie by a wide margin.
Here is the run of numbers we track year on year.
| Year | Google Ad Revenue | Year-On-Year Growth |
|---|---|---|
| 2021 | $209.49 billion | 42.6% |
| 2022 | $224.47 billion | 7.1% |
| 2023 | $237.86 billion | 6.0% |
| 2024 | $264.50 billion | 11.2% |
| 2025 | $294.69 billion | 11.4% |
| 2026 (our call) | $318 billion | 7.9% |
Notice the pattern. Growth slowed in 2022 and 2023, then reaccelerated. Bigger base, still climbing. That is rare at this scale.
Our 2026 figure of $318 billion is our own forecast. We built it from the 2025 growth rate, softened a little for a maturing US market. Analyst desks land in a similar zone, so we feel good about the call.
Our media-buyer read: A number this big means one thing for you. Auction pressure is not going away. Every dollar of that revenue is your competitor bidding against you. Ad credits and cashback are how smart buyers claw margin back while costs keep rising.
How Much Of Search Does Google Actually Own?
Google’s ad business runs on its grip over search itself. As of early 2026, Google holds close to 90% of the global search market share across all devices. Some trackers put it above 91% in mid-2026.
The rest fight over scraps. Here is the split.
On mobile Google is even stronger, sitting above 90% of the mobile search market. Desktop share runs a touch lower but still dominant.
Google processes billions of queries a day. Recent counts point to well over 13 billion daily searches, close to 5 trillion a year. That is the inventory pool you bid into.
From our own spend: Nine in ten searches still happen on Google. So even as buyers test TikTok and Reddit, Google search stays the default demand-capture channel. We treat it as the floor of any paid plan, not the whole plan.
What A Click Really Costs You In 2026
Now the number that stings: cost per click. The average cost per click across all industries in 2026 lands around $5.42 on the WordStream by LocaliQ dataset. Cross-platform blends that fold in Microsoft Ads sit near $5.26.
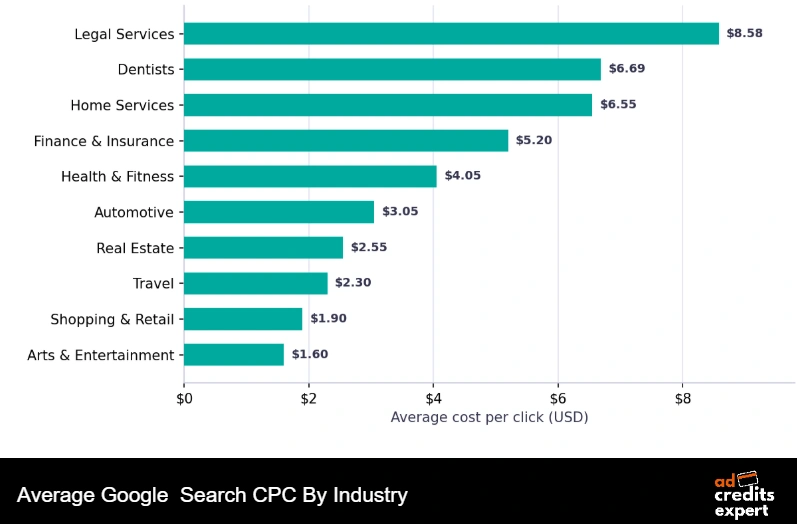
Whatever blend you use, the direction is up. CPCs rose for 87% of industries over the past year. Competition and AI-driven bidding both pushed prices higher.
Averages hide a lot, though. A click in legal costs many times more than a click in retail. Below are the industry ranges we see most often.
| Industry | Average Search CPC (2026) | Cost Tier |
|---|---|---|
| Arts & Entertainment | $1.60 | Low |
| Shopping & Retail | $1.90 | Low |
| Real Estate | $2.55 | Mid |
| Automotive | $3.05 | Mid |
| Health & Fitness | $4.05 | Mid |
| Finance & Insurance | $5.20 | High |
| Home Services | $6.55 | High |
| Dentists & Dental | $6.69 | High |
| Legal Services | $8.58 | Premium |
The gap between the cheapest and dearest verticals now runs close to tenfold. Back in 2016 that spread was under fourfold. High-value niches keep bidding harder each year.
One thing we always tell readers: never judge a click price alone. Judge it against customer value. A $9 click in legal is cheap when one case is worth $50,000. A $1.90 retail click is dear if your basket is $18.
What this means for your budget: Rising CPCs eat test budgets first. Before you scale a new offer, load your account with starter credit. A $1,500 Google Ads credit funds a real test at these prices, not a token one.
Click-Through Rates: What Good Looks Like Now
Old advice said a 2% click-through rate was fine. That advice is dead. The average Google search click-through rate now runs around 6.6% across industries.
Why the jump? Responsive search ads write sharper headlines. Sitelinks, callouts and AI-assisted assets take up more of the results page. More real estate means more clicks per impression.
Here is how click-through rates split by sector.
Notice the inverse link. High click-through sectors tend to have low CPCs. Strong click rates lift Quality Score, and better Quality Score cuts your cost per click. It compounds in your favour.
Display is a different world. The Google Display Network averages a click-through rate near 0.6%, roughly ten times lower than search. Display sells reach, not intent, so plan for it that way.
Conversion Rates And Cost Per Lead By Industry
Clicks are vanity. Conversions pay the bills. The average conversion rate by industry on Google search now sits around 7% to 8% across the board.
Median cost per lead across sectors lands near $70. That figure rose about 5% year on year, a gentler climb than the prior year’s 25% jump. Some cost stabilisation, finally.
| Metric | 2026 Cross-Industry Figure | What It Tells You |
|---|---|---|
| Average conversion rate | 7.0% to 8.2% | Share of clicks that convert |
| Median cost per lead | $70.11 | Spend to win one lead |
| Highest CPL vertical | Career & Employment, near $248 | Long, costly funnels |
| Lowest CPL vertical | Auto repair, near $29 | Fast, local intent |
| Lead cost vs click cost | Roughly 13x higher | Form drop-off is real |
Watch one quiet trend. Click-through rates went up whilst conversion rates slipped in most sectors during 2025. More people clicked. Fewer bought. That squeeze lands on your cost per acquisition.
Landing page quality is the usual culprit. A weak page tanks conversions no matter how good the ad. Fix the page before you blame the keyword.
Buyer’s note from us: If clicks climb but leads flatten, do not raise bids. Rebuild the landing page and tighten match types first. We have salvaged plenty of accounts by fixing the page, not the auction.
The ROI Question: What You Get Back Per Pound
Here is the stat Google loves to quote. Businesses earn about $2 back for every $1 spent on Google Ads. That is a 200% return before you optimise a thing.
Push harder and the ceiling lifts. Tight targeting, strong pages and clean tracking can take returns toward $8 per $1 in the best cases. Return on ad spend for ecommerce averages near 4x on the LocaliQ set.
Some verticals fly higher. Heavy equipment and manufacturing report ecommerce ROAS in the 540% to 690% range. Product value and margin drive most of that gap.
One caveat we live by. That 200% average assumes competent management. Sloppy targeting and broken tracking burn cash fast. Google will happily spend your budget either way.
Mobile Has Quietly Taken Over Your Spend
Mobile is not the future of Google Ads. It is the present. Around 64% of Google Ads clicks now come from smartphones, up from 58% in 2024.
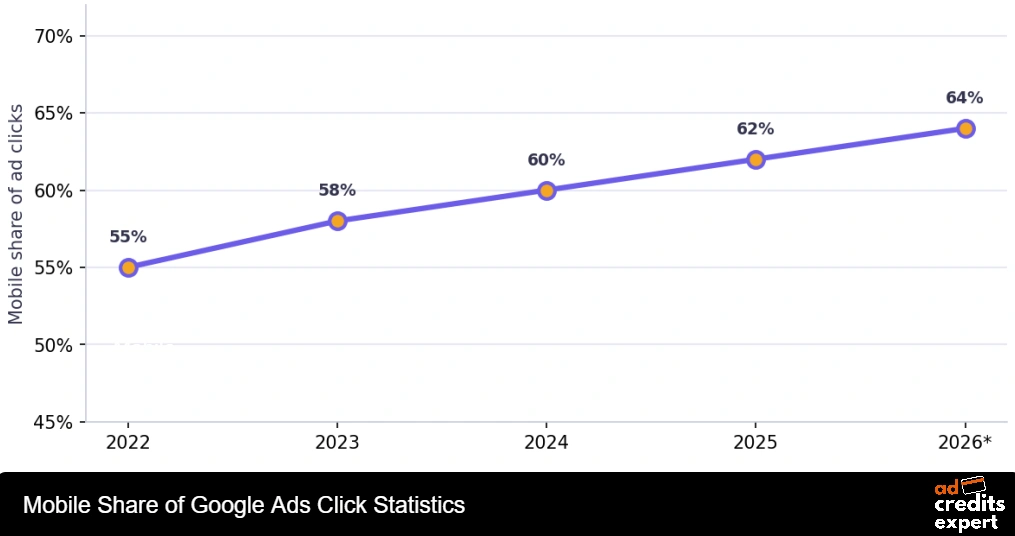
Money follows the clicks. Roughly two-thirds of Google Ads spend now serves on mobile devices. In some markets, like Australia, mobile clicks push near 88%.
But mobile carries a catch you must plan for. Here is the trade-off in plain terms.
| Device Metric | Mobile | Desktop |
|---|---|---|
| Share of ad clicks (2026) | Around 64% | Around 36% |
| Cost per click | About 24% lower | Higher base CPC |
| Conversion rate | Roughly 35% lower | Stronger conversions |
| Share of conversions | Around 47% | Around 53% |
Read that carefully. Mobile clicks are cheaper but convert less. Buyers who split bids by device and fix mobile pages report far stronger mobile returns than those running one blended strategy.
Our honest call: Do not chase cheap mobile clicks blindly. A slow mobile page wastes them. Test device bid adjustments, then judge mobile on its own cost per acquisition, never on click price.
Performance Max Ate The Account
Nothing reshaped Google Ads faster than automation. Performance Max campaigns went from a niche test to the default in a few short years.
Adoption tells the story. In 2022 roughly 8% of accounts ran Performance Max. By 2026 that figure climbs past 70%, with some datasets nearer 82%. Over a million advertisers now run it.
| Year | Accounts Running Performance Max | Shift |
|---|---|---|
| 2022 | Around 8% | Early adopters only |
| 2024 | Around 60% | Mainstream |
| 2025 | Around 71% | Near-universal |
| 2026 (our read) | 72% to 82% | Default choice |
Results back the hype, with caveats. Performance Max often delivers the lowest cost per acquisition in an account, sometimes near $44 on blended benchmarks. It pulls cheap inventory from Display, YouTube and Gmail.
The catch is control. You hand the algorithm the keys. It needs volume to learn, so accounts under 30 to 50 conversions a month rarely get the best from it.
AI Bidding And AI Max: The New Default
Automation now steers the money, not just the campaigns. Around 70% of Google Ads spend flows through automated, AI-powered bidding strategies in 2026.
The gains are real when you feed it well. Accounts on AI bidding report roughly 22% lower cost per conversion than manual bidding. The edge grows with account maturity and conversion volume.
Google’s newer AI Max for Search takes things further. It optimises audiences, bids and creative on its own. Campaigns using the full suite see about 7% more conversions at similar cost, with some upgrades hitting a 27% lift.
Straight talk: AI bidding is only as smart as the data you give it. Garbage conversions in, garbage bids out. We audit tracking before touching any bid strategy, every single time.
Google Shopping And The Retail Media Squeeze
Shopping ads quietly became a giant for retail buyers. Product listings now drive a huge share of retail ad clicks on Google.
Around 21% of US ecommerce ad spend now flows through Google Shopping. Shopping CPCs run cheaper than search text ads, often in the $0.50 to $0.95 band.
Performance Max feeds most of this now. In many retail accounts, the bulk of product ad spend runs through automated Shopping inside Performance Max, not standalone Shopping campaigns.
The pressure point is retail media. Amazon Ads keeps eating share of product search budgets. Google is fighting to keep retail advertisers with cheaper, AI-fed formats.
Display Versus Search: Where Clicks Come Cheap
Search and Display serve two different jobs. Mixing them up wastes budget, so keep the split clear in your head.
Display CPCs sit far below search, often under $0.50 a click. The Google Display Network reach spans over two million sites, apps and videos, touching most of the connected world.
Use Display for awareness and remarketing, not for last-click sales. We warm cold audiences on Display, then close them on search and shopping where intent is hot.
YouTube Ads And Demand Gen Enter The Mix
Search is not the only money engine. YouTube sits right inside Google Ads, and it is getting bigger every year.
The scale is easy to miss. YouTube’s ads and subscriptions together topped $60 billion for the full year 2025. Ad revenue on the platform grew close to 9% in the latest reported period.
Paying audiences grew too. YouTube now counts over 325 million paid subscriptions across Premium, Music and Google One. That is a large, loyal pool for advertisers to reach.
The format doing the heavy lifting is Demand Gen. It replaced Google’s older feed-based ad campaigns and runs on AI across several surfaces.
We treat Demand Gen as the top-of-funnel partner to search. Video and social-style placements build the demand. Search and Shopping then capture it when intent shows up.
One tip from our own runs. Feed Demand Gen strong creative and clear audience signals, then let it learn. Starved of good assets, it drifts and spends without much to show for it.
Our 2026 call: Video is no longer a nice-to-have inside Google Ads. As search clicks get pricier, cheaper YouTube reach becomes the smart way to fill the funnel before buyers ever type a query.
Who Is Actually Spending On Google Ads?
Almost everyone, is the honest answer. Around 96% of brands worldwide put money into Google Ads. Roughly 65% of businesses run it specifically for pay-per-click.
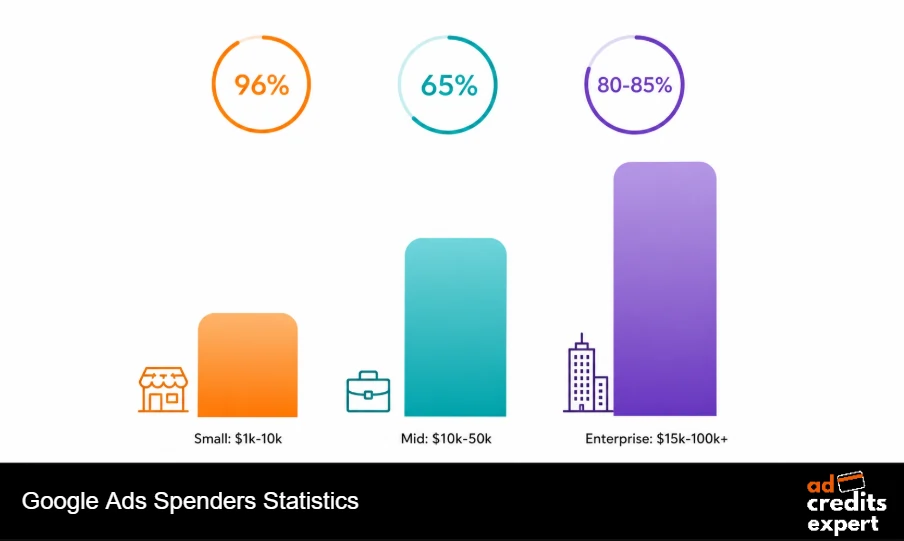
Budgets vary wildly by company size. Here is the rough spread we see across the accounts we advise.
| Business Type | Typical Monthly Google Ads Budget | Common Goal |
|---|---|---|
| Small business | $1,000 to $10,000 | Local leads and calls |
| Mid-market brand | $10,000 to $50,000 | Scale and pipeline |
| Enterprise | $15,000 to $100,000+ | Market share and reach |
Among PPC professionals the platform is close to mandatory. Nearly all paid search specialists use Google Ads. Most PPC budgets, around 80% to 85%, flow straight into it.
AdCredits Expert call: New advertisers leave money on the table constantly. Google offers starter credit worth up to $1,500, plus cashback on top through partners. Claim it before your first campaign, not after you have burned cash.
Is Google Losing Its Grip? The Competition Check
Here is the plot twist of 2026. Google is still huge, but no longer untouchable at the very top.
Google takes about 26.4% of worldwide digital ad spend. Meta is set to edge ahead near 26.8%, the first time it has ever led. Google’s absolute dollars still grow, but Meta grows faster from a similar base.
US search tells a sharper story. Google will earn about 48.5% of US search ad spend in 2026. That drops below half for the first time in over two decades. Amazon is taking the biggest bite.
Do not misread this. Google is not shrinking. Its lead is just narrowing as retail media and social close the gap.
AI Overviews And The Click You No Longer Get
The biggest shift to your organic traffic is AI Overviews. Google’s AI answers now reach over 2.5 billion monthly users. AI Mode has passed a billion.
These answers appear on a rising share of results. Some counts put AI Overviews on 15% to 30% of queries. When they show, organic click volume drops, often by 8% to 12%.
Fewer free clicks pushes more demand into paid. That is part of why CPCs keep climbing. As organic gets harder, paid search becomes the reliable route to the top of the page.
What we do with this: We stopped relying on cheap organic clicks for transactional queries. Paid capture at the bottom of the funnel is now core, not optional. Credits and cashback keep that shift affordable.
Our 2026 Forecast For Google Ads
Time for our own numbers. Based on the accounts we run and the spend we track, here is where we think Google Ads heads through the rest of 2026.
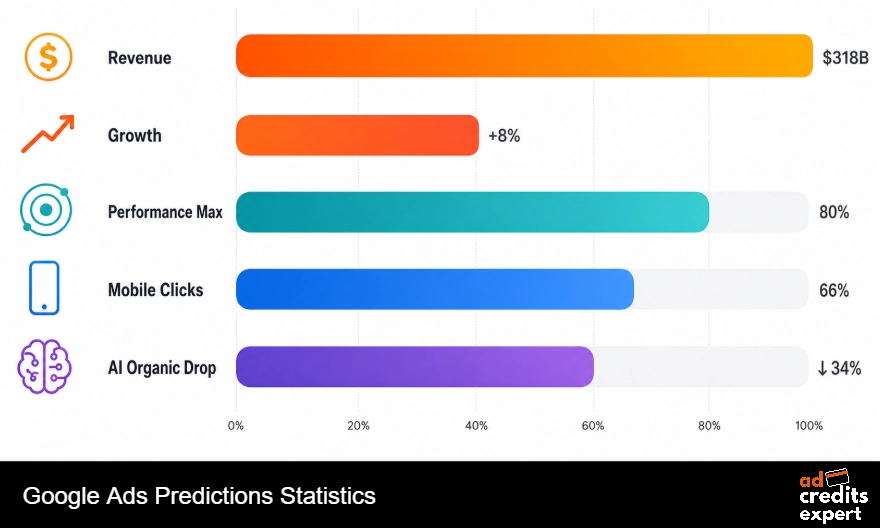
None of this is guesswork pulled from thin air. We priced these calls off live campaign data and the reported figures above. When costs rise this fast, the buyers who win are the ones who cut their effective spend with credits, not the ones who simply pay more.
The Wasted Spend Nobody Likes To Admit
Here is an uncomfortable truth. A big slice of most budgets never had a chance to convert. Studies of thousands of accounts show the average business burns over $1,127 a month on clicks that go nowhere.
Local advertisers have it worse. Many waste 30% to 50% of their budget on the wrong clicks. Job seekers, DIY researchers and idle browsers all cost you money.
Where does that wasted ad spend hide? From the accounts we audit, the leaks repeat.
Google’s own tools make this harder to spot. The search terms report now hides a rising share of query data. Less visibility means waste piles up quietly for weeks.
The fix is not fancy. Read your search terms report often. Add negatives every week. Split proven keywords into tight exact-match groups, and cap broad match to a small testing budget.
From the accounts we manage: Cutting waste beats raising budget nearly every time. We often find 20% of spend doing zero work. Recover that first, then scale with credit on top so the test costs you less.
Quality Score: The Discount Hiding In Your Account
Most advertisers ignore Quality Score. That is a costly habit. A strong score is a direct discount on your cost per click.
The numbers are blunt. Accounts with a Quality Score of 8 to 10 pay around 37% less per click than the median. Reaching a score of 10 can cut your CPC by close to half.
Yet most accounts sit average. Across more than 15,000 accounts, the typical Quality Score lands at 5 to 6. A 7 already puts you ahead of most rivals.
Three parts drive the score, and each is inside your control.
We have watched a keyword drop from a $40 CPC to $22 after fixing the page and tightening the ad group. Same keyword, same bids. Quality Score was the hidden tax the whole time.
Our read: Chasing a perfect 10 rarely pays off. Aim for 7 or 8 across your money keywords. That band captures most of the CPC saving without draining your time on the last point.
Local Services Ads And Near Me Demand
Local intent runs deep in search. Close to half of all Google searches carry local intent. People want a business near them, and they want it now.
Google keeps feeding that intent. Google Maps serves over a billion monthly users, many of whom see local ads. “Near me” queries stay one of the fastest growing search patterns.
The biggest local shift is Local Services Ads. These pay-per-lead ads sit above everything else, carry a verified badge, and bill per lead rather than per click.
Adoption is climbing fast. Local Services Ads appeared in about 31% of tracked local queries by late 2025, up from 11% earlier that year. Close to a tripling in months.
For service businesses that matters. A pay-per-lead model trims wasted spend on browsers who were never going to call. You pay for a lead, not a curious click.
Buyer’s note: If you run a local service, test Local Services Ads before pouring more into standard search. The badge builds trust, and the top slot pulls clicks away from everyone below it.
Google Ads Statistics 2026: Frequently Asked Questions
What is the average cost per click on Google Ads in 2026?
The average cost per click across all industries in 2026 is about $5.42 on the WordStream by LocaliQ dataset. Blends that include Microsoft Ads sit near $5.26. Legal clicks top the range near $8.58, whilst retail and arts sit under $2.
How much revenue did Google Ads make in 2025?
Google made $294.69 billion in advertising during 2025. That helped Alphabet cross $402.8 billion in total revenue, up 15% on the year. Advertising still funds roughly three-quarters of the company.
What is a good click-through rate for Google Ads now?
The average search click-through rate runs near 6.6% in 2026. Anything above that is strong. Display sits far lower, near 0.6%, since it targets reach rather than intent.
What is the average ROI on Google Ads?
Google reports around $2 back for every $1 spent, a 200% return. Well-optimised accounts with strong pages can reach $8 per $1. Ecommerce return on ad spend averages near 4x.
Does Google still dominate search in 2026?
Yes. Google holds close to 90% of worldwide search across devices. It slips below half of US search ad spend for the first time, but that is competition at the top, not a fall in search dominance.
Can I still get free Google Ads credits in 2026?
Yes. New advertisers can claim starter credit worth up to $1,500, plus cashback through partners on top. We keep the current verified Google Ads deal live on our deals page, with no signup wall.
Sources And Further Reading
- Alphabet Investor Relations, Q4 and Full-Year 2025 Results
- Statista, Google Advertising Revenue 2001 to 2025
- WordStream by LocaliQ, 2026 Google Ads Benchmarks
- LocaliQ, 2026 Search Advertising Benchmarks By Industry
- eMarketer, US Search Advertising Forecast 2026
- StatCounter, Global Search Engine Market Share
- Search Engine Journal, Google Ads Benchmarks Study 2026

About the author

Jordan Blake
A digital advertising specialist with years of experience in optimizing ad spend and leveraging promotional credits across platforms like Google Ads, Meta Ads, and more.
Similar Posts




Spend $200 → Get $200
Spend $500 → Get $500
Spend $1,000 → Get $1,000
Spend $4,000 → Get $4,000
Spend $6,000 → Get $6,000
Leave a Reply